# Import all required libraries
import pandas as pd
import numpy as np
import seaborn as sns
import matplotlib.pyplot as plt
from sklearn.decomposition import PCA
from sklearn.manifold import TSNE
from sklearn.preprocessing import StandardScaler
from sklearn.impute import SimpleImputer
import statsmodels.api as sm
import scipy.stats as stats
from scipy.stats import gaussian_kde
from scipy.signal import find_peaks, argrelextrema
from scipy.stats import pearsonr


# Increase font size of all Seaborn plot elements
sns.set(font_scale = 1.25)

# Set Seaborn theme
sns.set_theme(style = "whitegrid")
Data Preprocessing
Lecture 4
Datasets
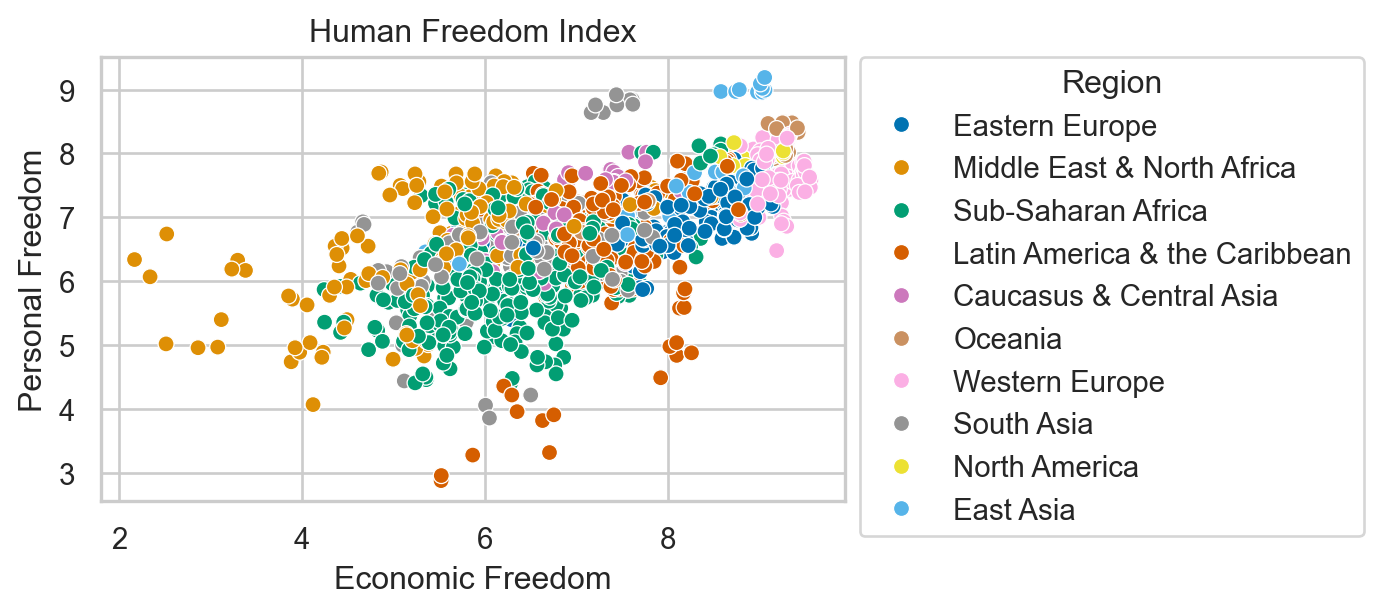
Human Freedom Index
The Human Freedom Index is a report that attempts to summarize the idea of “freedom” through variables for many countries around the globe.
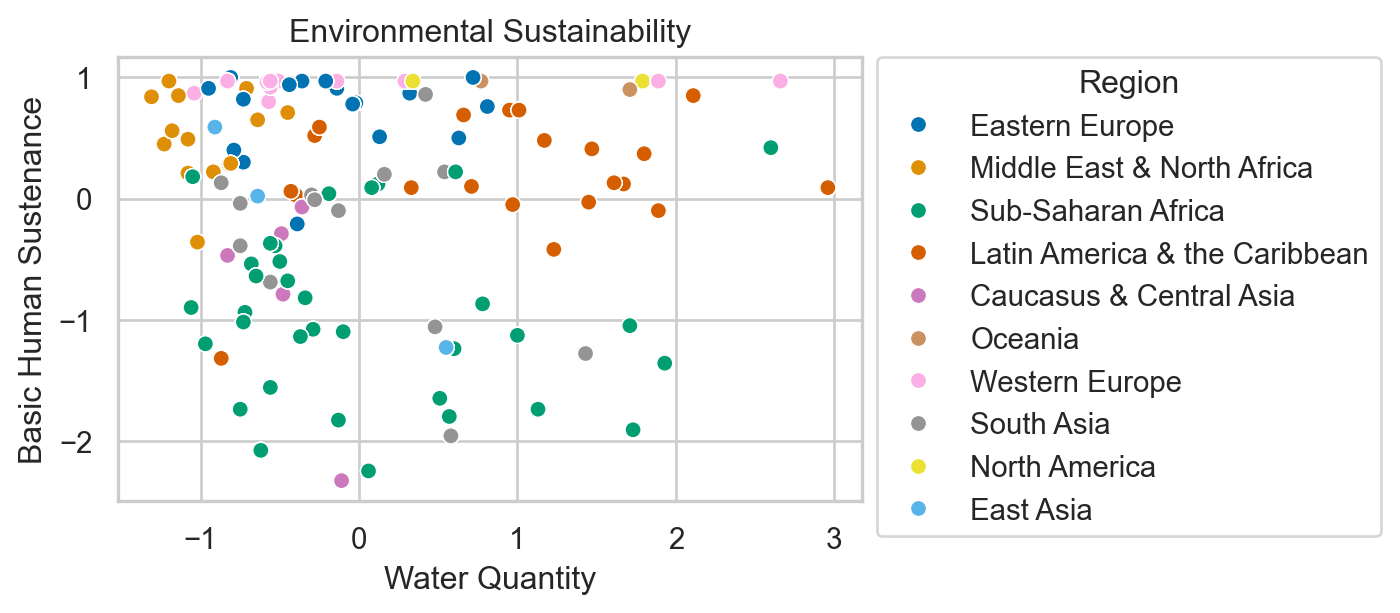
Environmental Sustainability
Countries are given an overall sustainability score as well as scores in each of several different environmental areas.
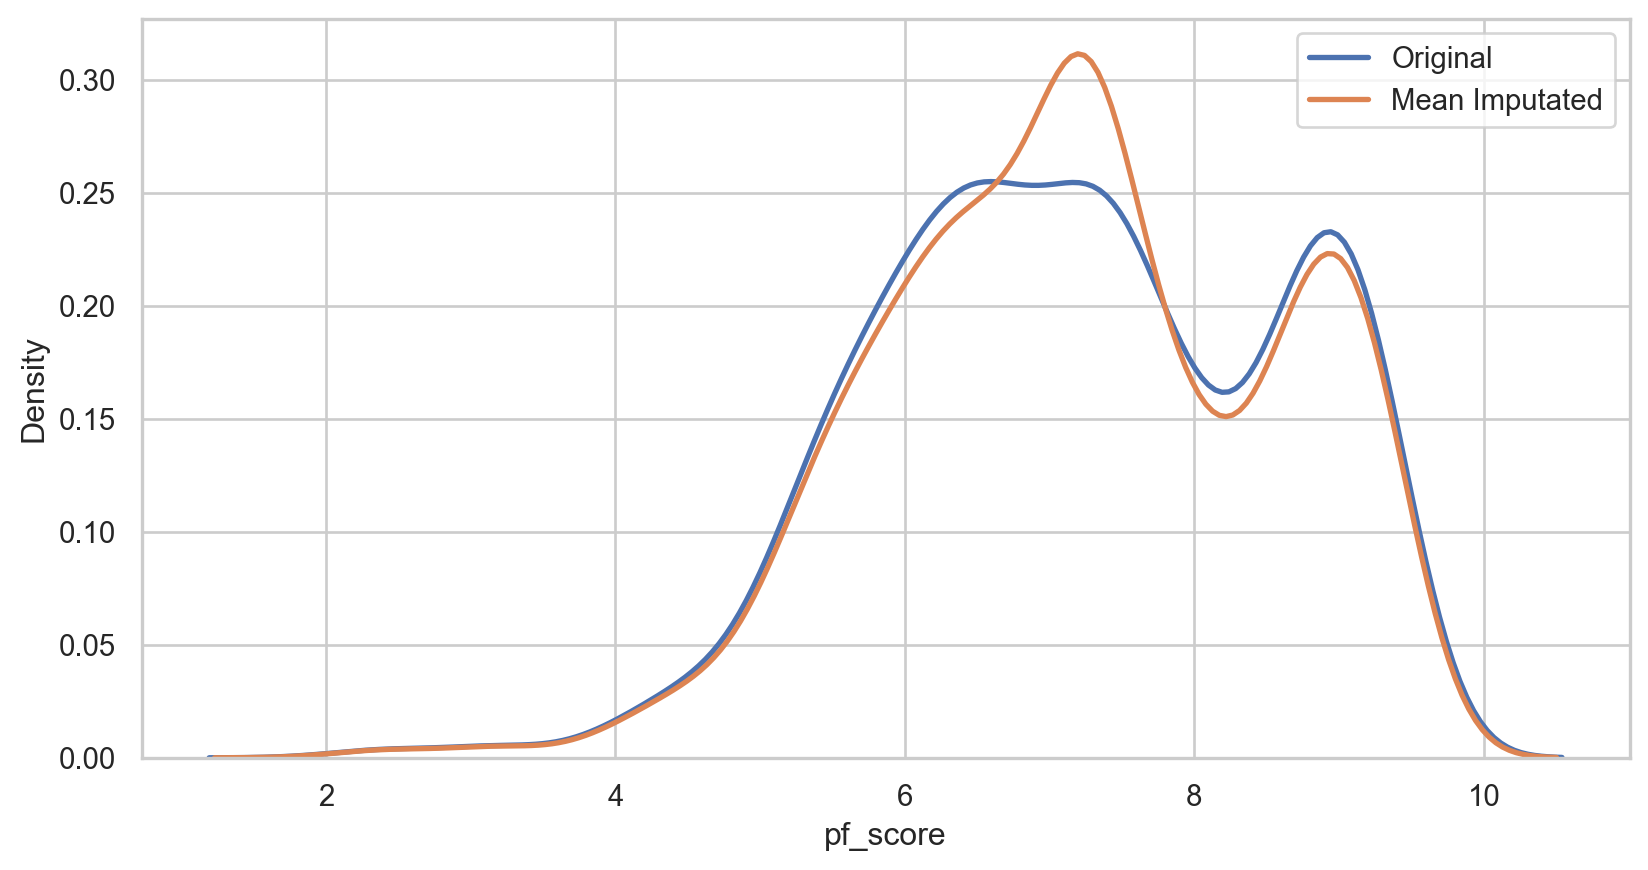
Mean imputation
How it Works: Replace missing values with the arithmetic mean of the non-missing values in the same variable.
Pros:
- Easy and fast.
- Works well with small numerical datasets
Cons:
- It only works on the column level.
- Will give poor results on encoded categorical features.
- Not very accurate.
- Doesn’t account for the uncertainty in the imputations.
hfi_copy = hfi
mean_imputer = SimpleImputer(strategy = 'mean')
hfi_copy['mean_pf_score'] = mean_imputer.fit_transform(hfi_copy[['pf_score']])
mean_plot = sns.kdeplot(data = hfi_copy, x = 'pf_score', linewidth = 2, label = "Original")
mean_plot = sns.kdeplot(data = hfi_copy, x = 'mean_pf_score', linewidth = 2, label = "Mean Imputated")
plt.legend()
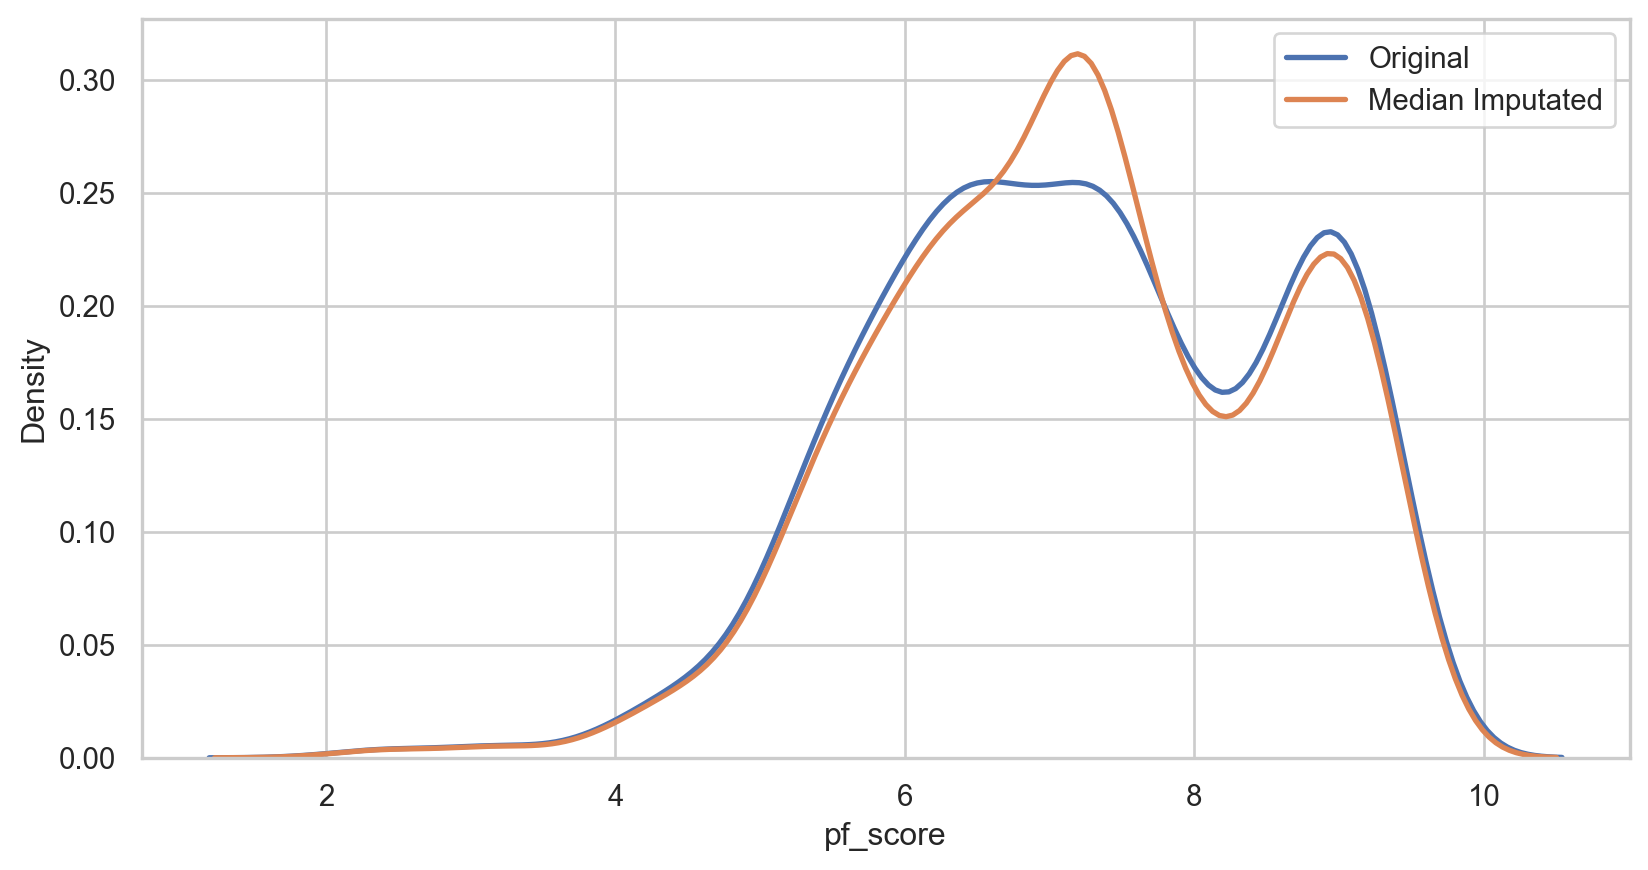
plt.show()Median imputation
How it Works: Replace missing values with the median of the non-missing values in the same variable.
Pros (same as mean):
- Easy and fast.
- Works well with small numerical datasets
Cons (same as mean):
- It only works on the column level.
- Will give poor results on encoded categorical features.
- Not very accurate.
- Doesn’t account for the uncertainty in the imputations.
median_imputer = SimpleImputer(strategy = 'median')
hfi_copy['median_pf_score'] = median_imputer.fit_transform(hfi_copy[['pf_score']])
median_plot = sns.kdeplot(data = hfi_copy, x = 'pf_score', linewidth = 2, label = "Original")
median_plot = sns.kdeplot(data = hfi_copy, x = 'median_pf_score', linewidth = 2, label = "Median Imputated")
plt.legend()
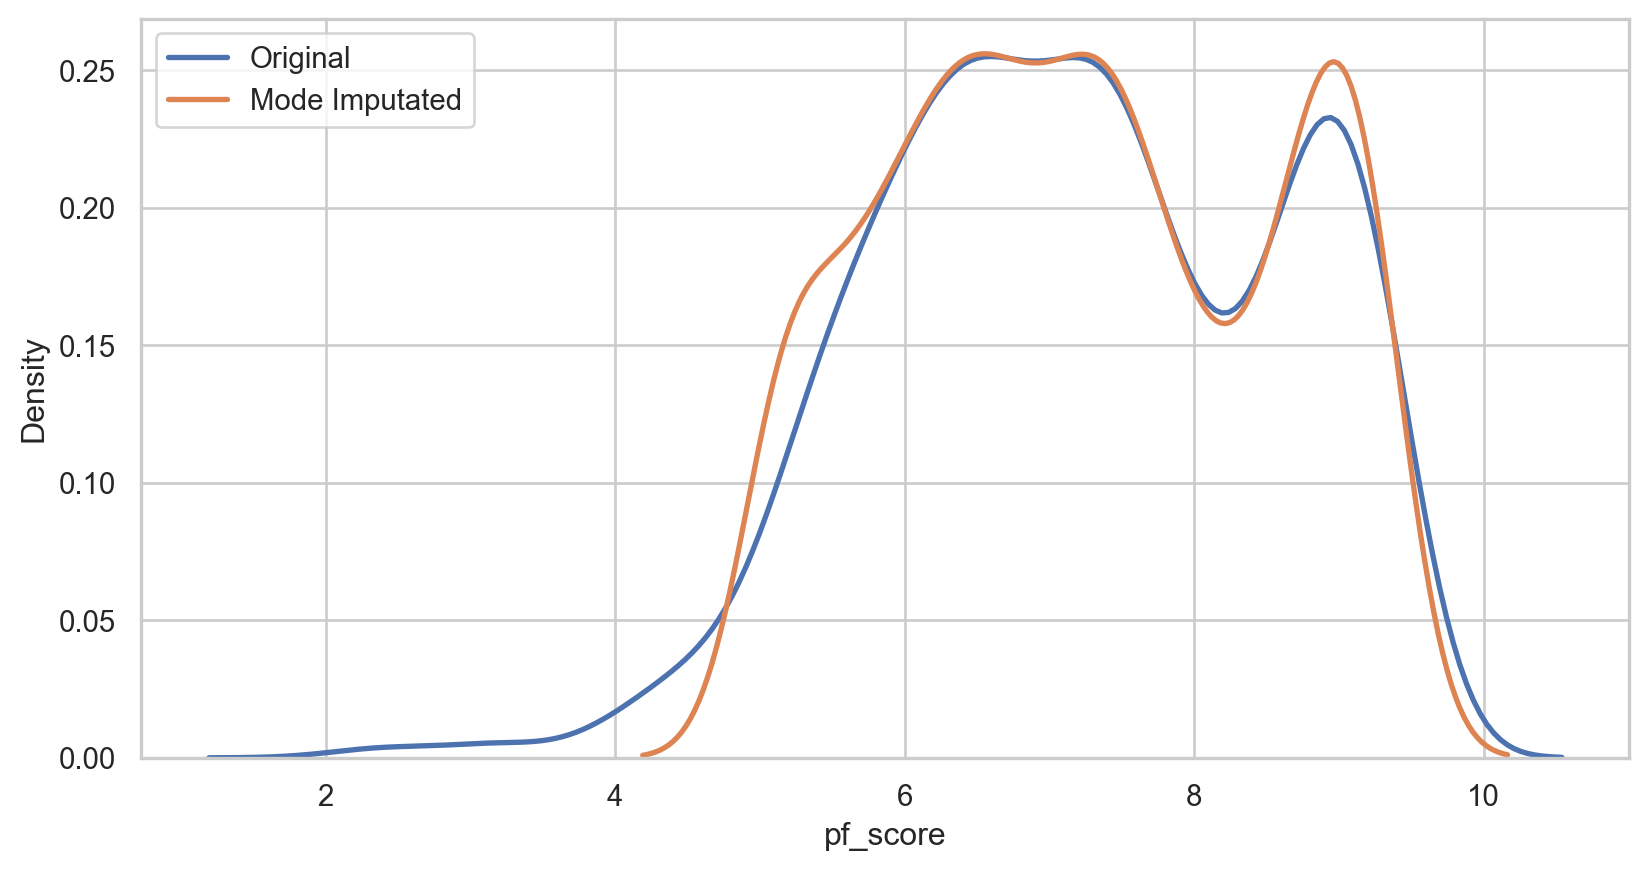
plt.show()Mode imputation
How it Works: Replace missing values with the mode of the non-missing values in the same variable.
Pros:
- Easy and fast.
- Works well with categorical features.
Cons:
- It also doesn’t factor the correlations between features.
- It can introduce bias in the data.

mode_imputer = SimpleImputer(strategy = 'most_frequent')
hfi_copy['mode_pf_score'] = mode_imputer.fit_transform(hfi_copy[['pf_score']])

mode_plot = sns.kdeplot(data = hfi_copy, x = 'pf_score', linewidth = 2, label = "Original")

mode_plot = sns.kdeplot(data = hfi_copy, x = 'mode_pf_score', linewidth = 2, label = "Mode Imputated")

plt.legend()

plt.show()
Capping (Winsorizing) imputation
How it Works: Removing extreme values, or outliers based on cut-offs
Pros:
- Not influenced by extreme values
Cons:
- Capping only modifies the smallest and largest values slightly.
- If no extreme outliers are present, Winsorization may be unnecessary.
upper_limit = np.percentile(hfi_copy['pf_score'].dropna(), 95)
lower_limit = np.percentile(hfi_copy['pf_score'].dropna(), 5)

hfi_copy['capped_pf_score'] = np.clip(hfi_copy['pf_score'], lower_limit, upper_limit)

cap_plot = sns.kdeplot(data = hfi_copy, x = 'pf_score', linewidth = 2, label = "Original")

cap_plot = sns.kdeplot(data = hfi_copy, x = 'capped_pf_score', linewidth = 2, label = "Mode Imputated")

plt.legend()

plt.show()Filtering data
Let’s look at USA, India, Canada, China
Let’s look at Economic Freedom > 75
Normalizing
Mean: 5
Standard Deviation: 2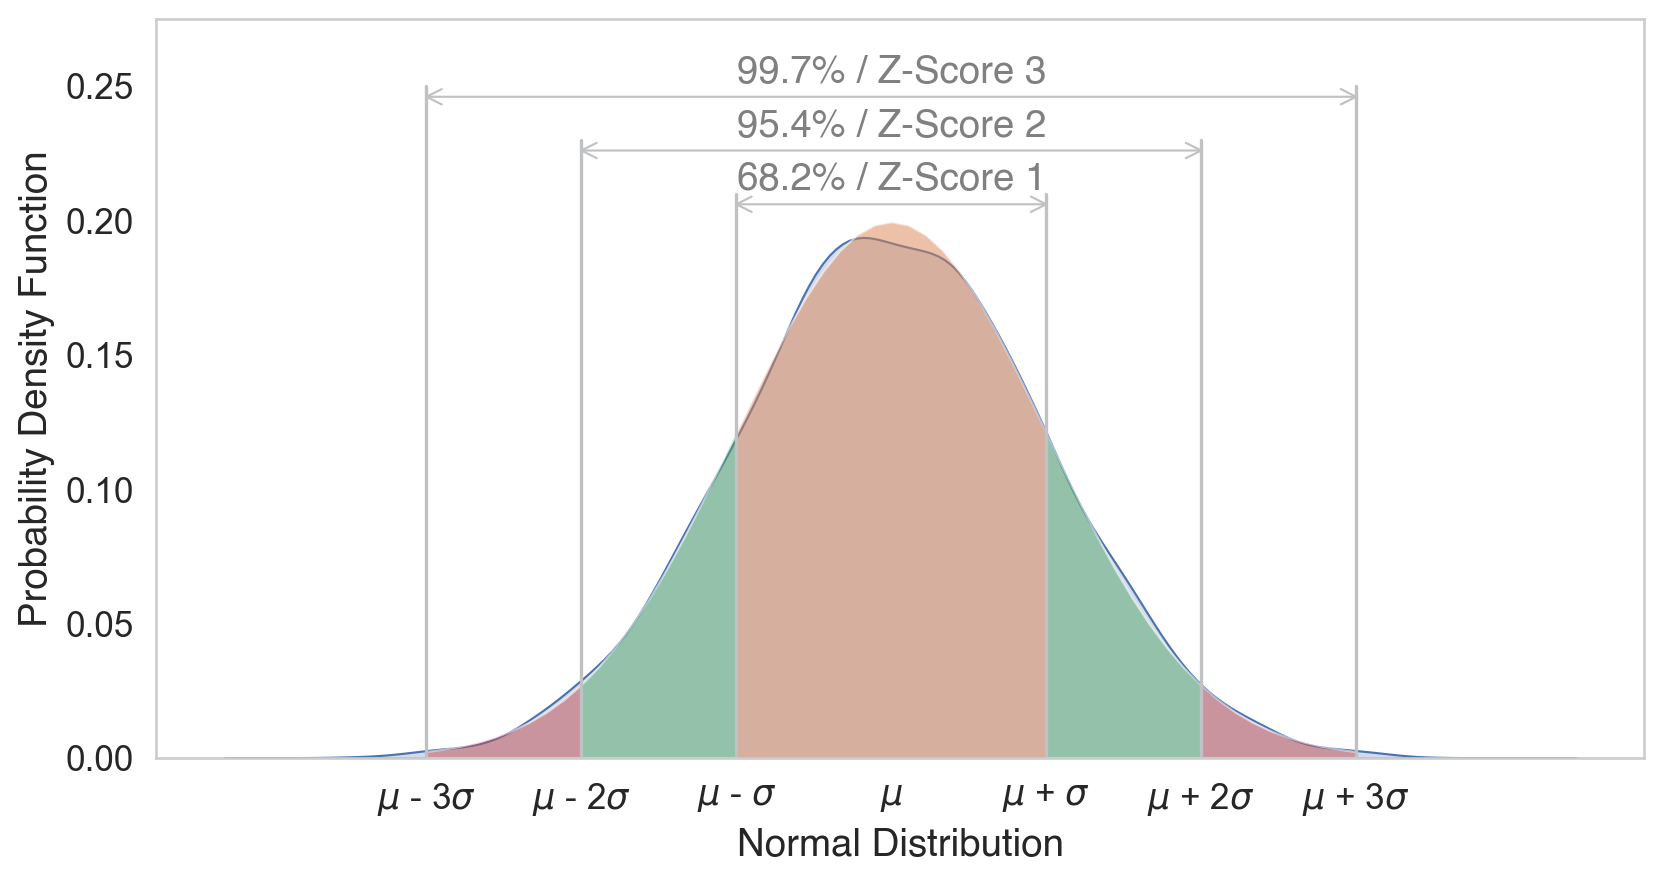
hfi_copy = hfi

scaler = StandardScaler()
hfi_copy[['ef_score_scale', 'pf_score_scale']] = scaler.fit_transform(hfi_copy[['ef_score', 'pf_score']])

hfi_copy[['ef_score_scale', 'pf_score_scale']].describe()| ef_score_scale | pf_score_scale | |
|---|---|---|
| count | 1.378000e+03 | 1.378000e+03 |
| mean | 4.524683e-16 | 2.062533e-17 |
| std | 1.000363e+00 | 1.000363e+00 |
| min | -4.421711e+00 | -3.663087e+00 |
| 25% | -6.063870e-01 | -7.303950e-01 |
| 50% | 1.295064e-01 | -8.926277e-03 |
| 75% | 7.068997e-01 | 9.081441e-01 |
| max | 2.722116e+00 | 1.722056e+00 |
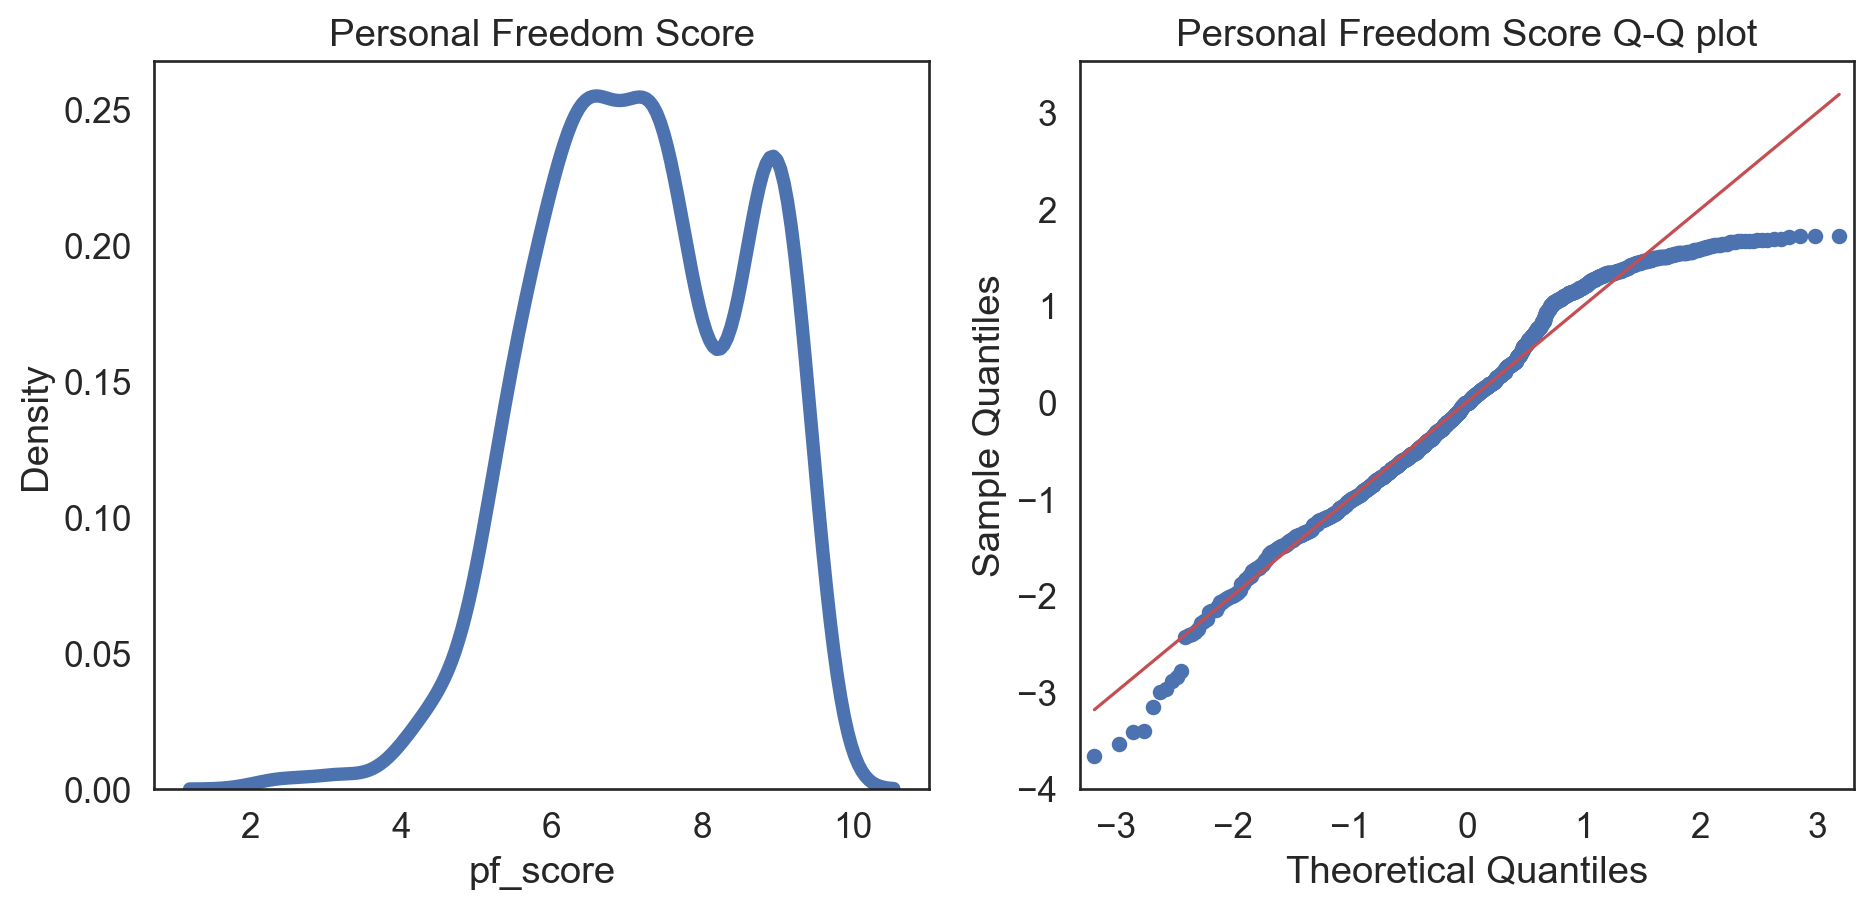
Normality test: Q-Q plot
Code
hfi_clean = hfi_copy.dropna(subset = ['pf_score'])

sns.set_style("white")

fig, (ax1, ax2) = plt.subplots(ncols = 2, nrows = 1)

sns.kdeplot(data = hfi_clean, x = "pf_score", linewidth = 5, ax = ax1)
ax1.set_title('Personal Freedom Score')

sm.qqplot(hfi_clean['pf_score'], line = 's', ax = ax2, dist = stats.norm, fit = True)
ax2.set_title('Personal Freedom Score Q-Q plot')

plt.tight_layout()
plt.show()
There were some issues in our plots:
Left Tail: Points deviate downwards from the line, indicating more extreme low values than a normal distribution (negative skewness).
Central Section: Points align closely with the line, suggesting the central data is similar to a normal distribution.
Right Tail: Points curve upwards, showing potential for extreme high values (positive skewness).
Comparing transformations
Moderate negative skew, no zeros or negative values
Code
hfi_clean['pf_score_sqrt'] = np.sqrt(hfi_clean['pf_score'])

col = hfi_clean['pf_score_sqrt']

fig, (ax1, ax2) = plt.subplots(ncols = 2, nrows = 1)

sns.kdeplot(col, linewidth = 5, ax = ax1)
ax1.set_title('Square-root Density plot')

sm.qqplot(col, line = 's', ax = ax2)
ax2.set_title('Square-root Q-Q plot')
plt.tight_layout()
plt.show()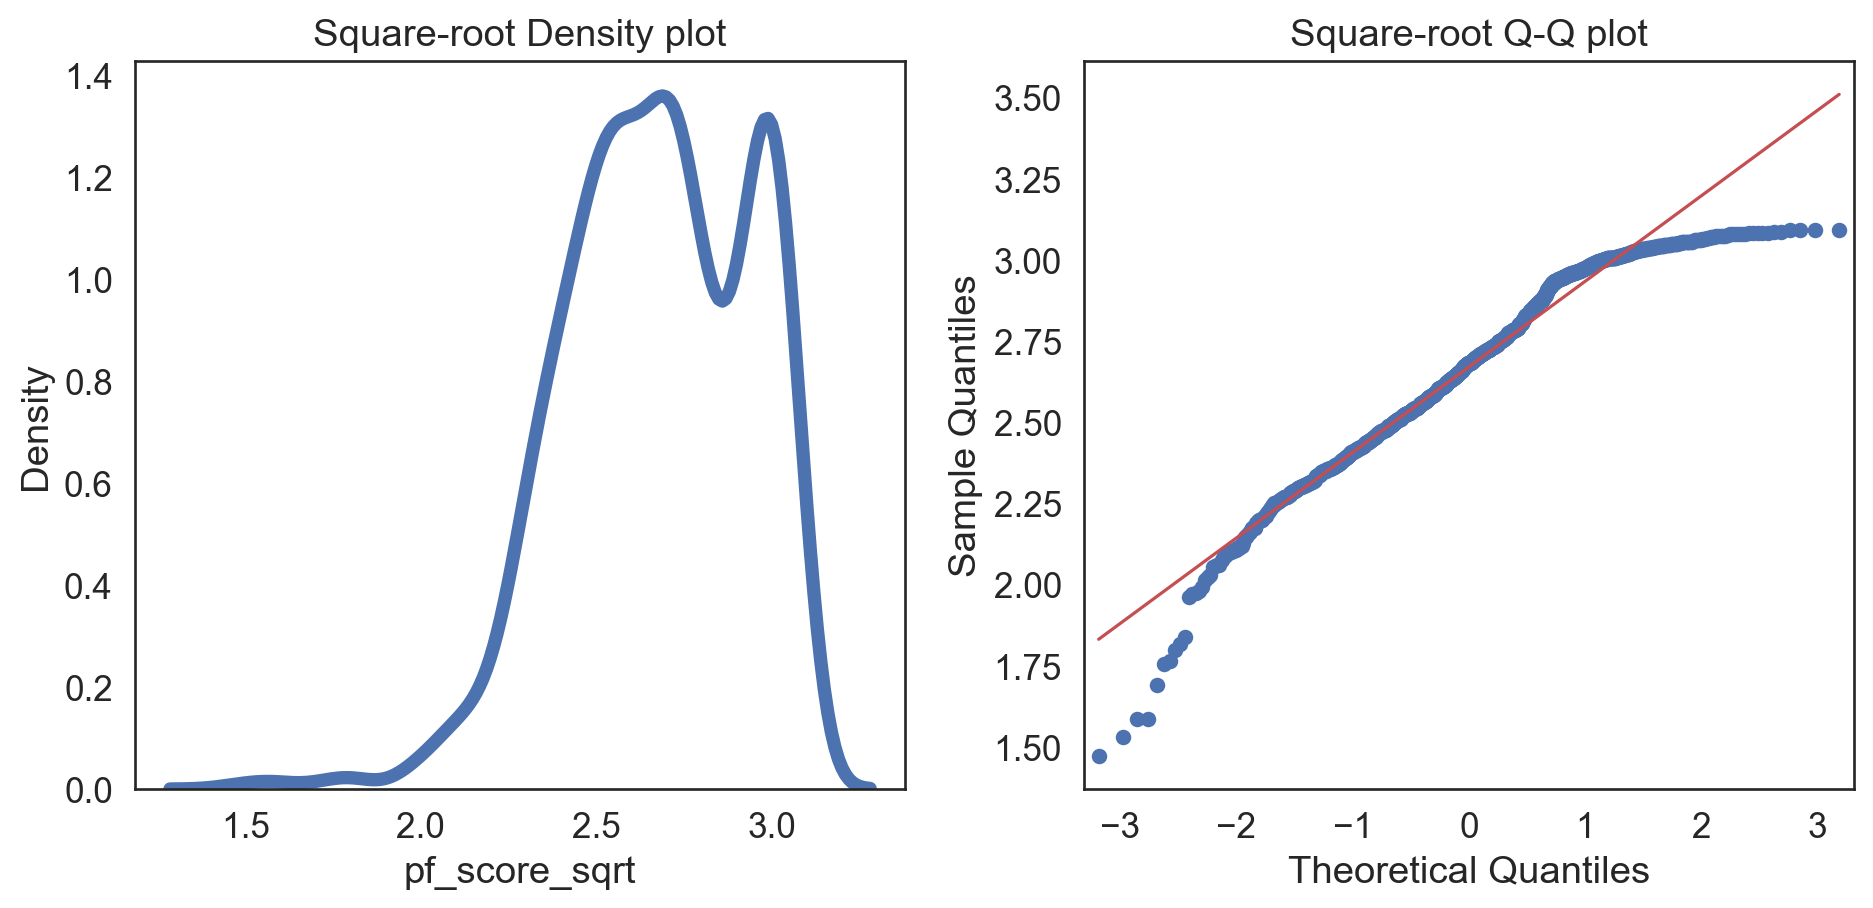
Code
hfi_clean['pf_score_log'] = np.log(hfi_clean['pf_score'] + 1)

col = hfi_clean['pf_score_log']

fig, (ax1, ax2) = plt.subplots(ncols = 2, nrows = 1)

sns.kdeplot(col, linewidth = 5, ax = ax1)
ax1.set_title('Log Density plot')

sm.qqplot(col, line = 's', ax = ax2)
ax2.set_title('Log Q-Q plot')
plt.tight_layout()
plt.show()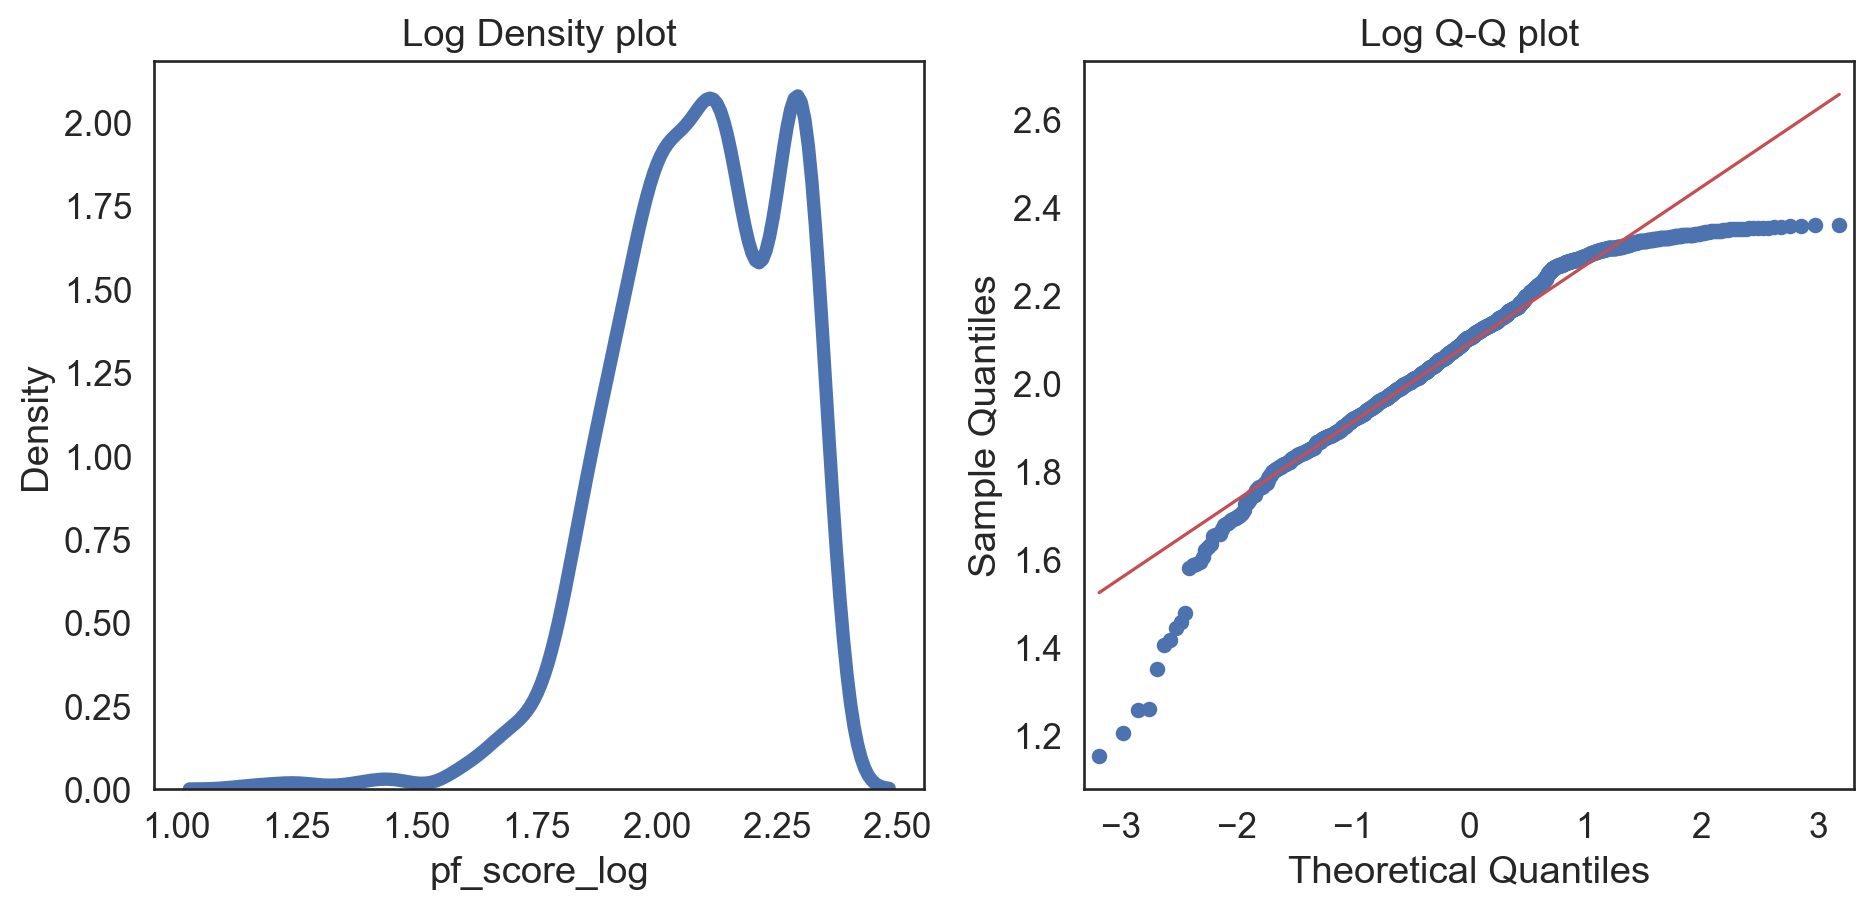
Code
hfi_clean['pf_score_inv'] = 1/hfi_clean.pf_score

col = hfi_clean['pf_score_inv']

fig, (ax1, ax2) = plt.subplots(ncols = 2, nrows = 1)

sns.kdeplot(col, linewidth = 5, ax = ax1)
ax1.set_title('Inverse Density plot')

sm.qqplot(col, line = 's', ax = ax2)
ax2.set_title('Inverse Q-Q plot')
plt.tight_layout()
plt.show()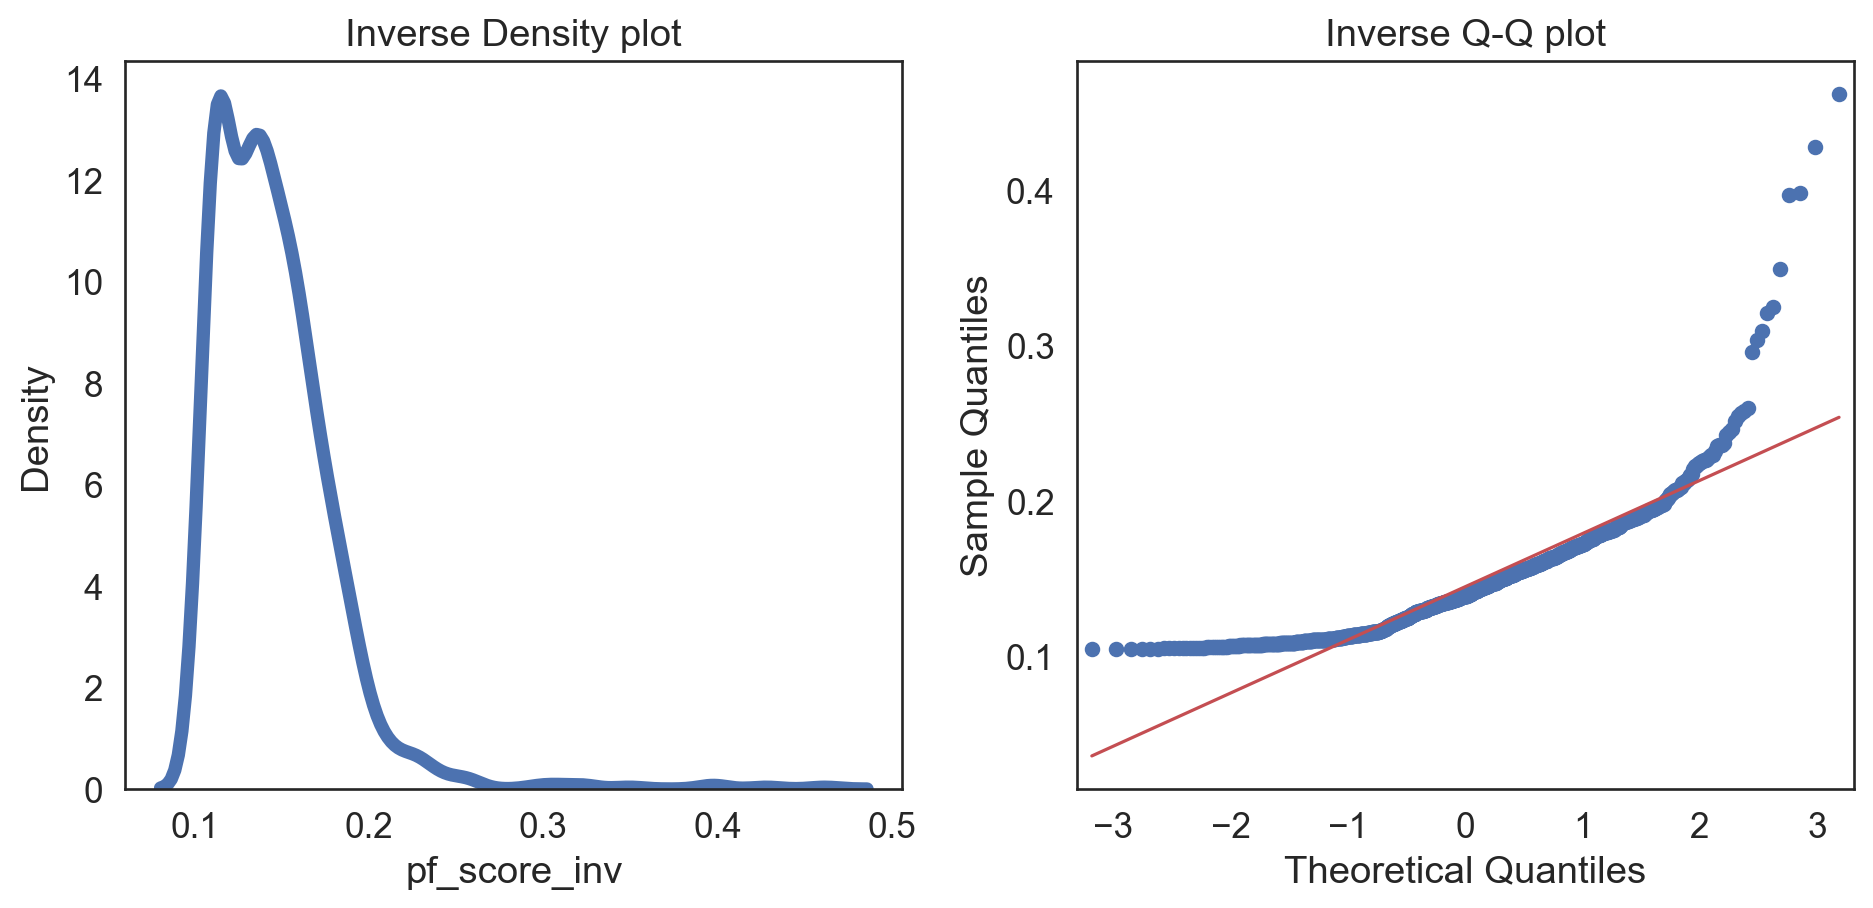
Code
hfi_clean['pf_score_square'] = pow(hfi_clean.pf_score, 2)

col = hfi_clean['pf_score_square']

fig, (ax1, ax2) = plt.subplots(ncols = 2, nrows = 1)

sns.kdeplot(col, linewidth = 5, ax = ax1)
ax1.set_title('Squared Density plot')

sm.qqplot(col, line = 's', ax = ax2)
ax2.set_title('Squared Q-Q plot')
plt.tight_layout()
plt.show()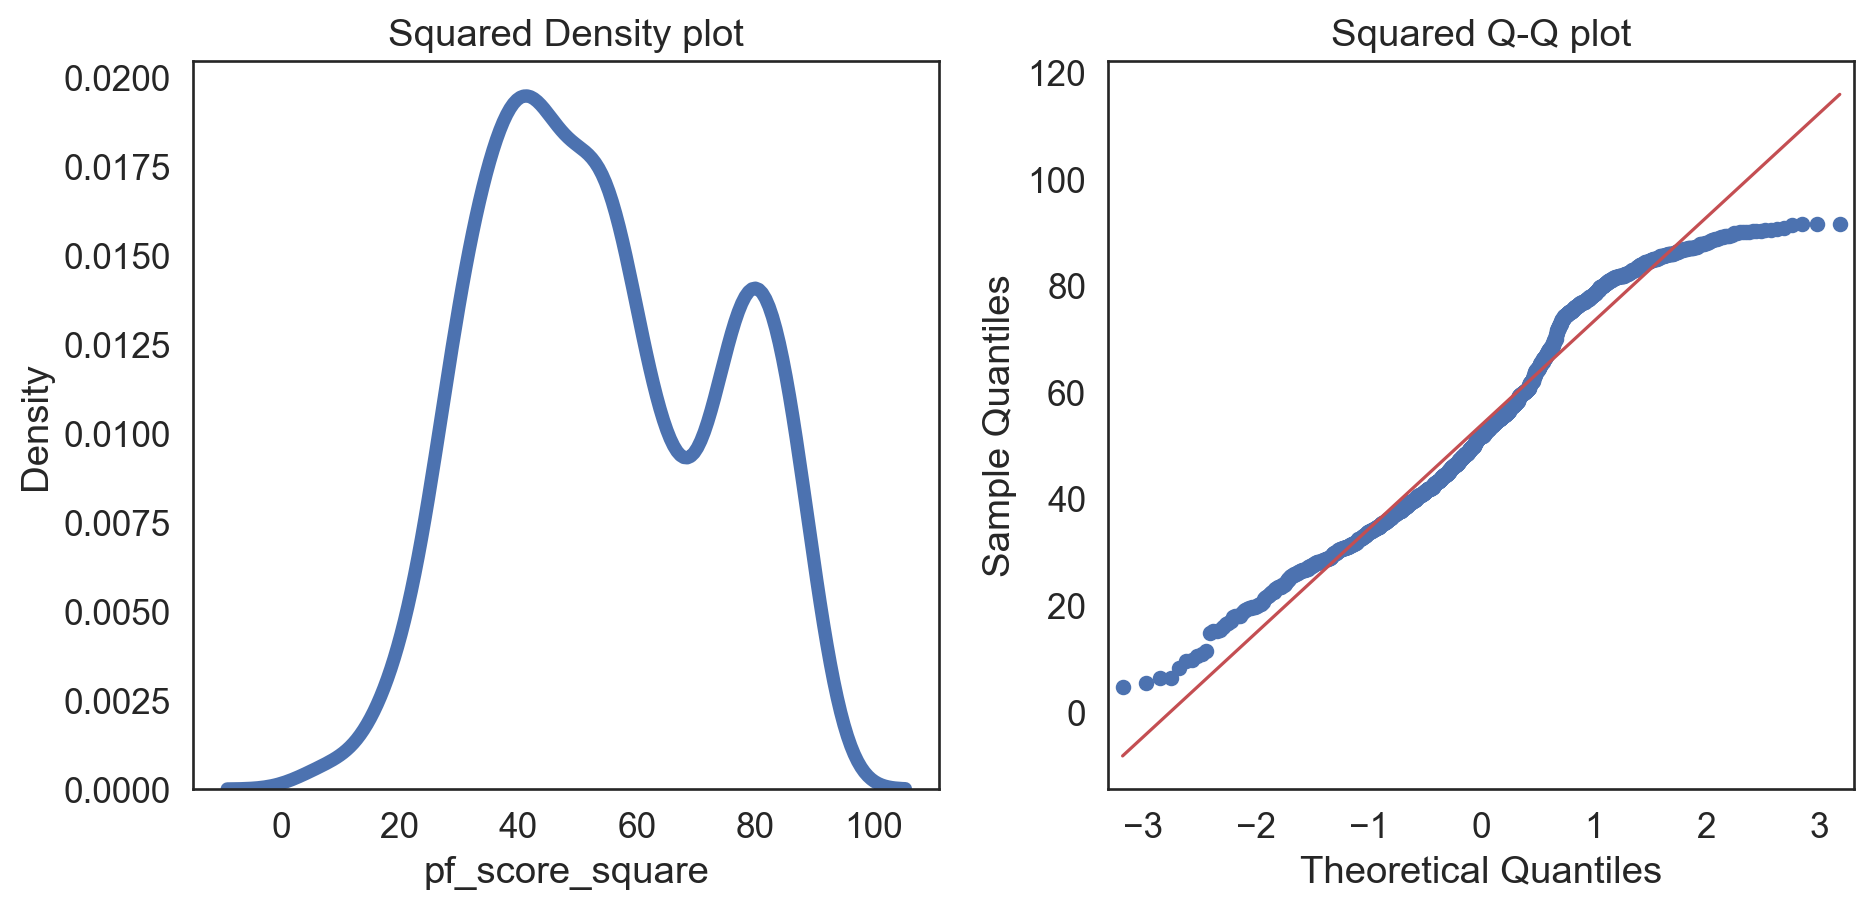
Code
hfi_clean['pf_score_cube'] = pow(hfi_clean.pf_score, 3)

col = hfi_clean['pf_score_cube']

fig, (ax1, ax2) = plt.subplots(ncols = 2, nrows = 1)

sns.kdeplot(col, linewidth = 5, ax = ax1)
ax1.set_title('Cubed Density plot')

sm.qqplot(col, line = 's', ax = ax2)
ax2.set_title('Cubed Q-Q plot')
plt.tight_layout()
plt.show()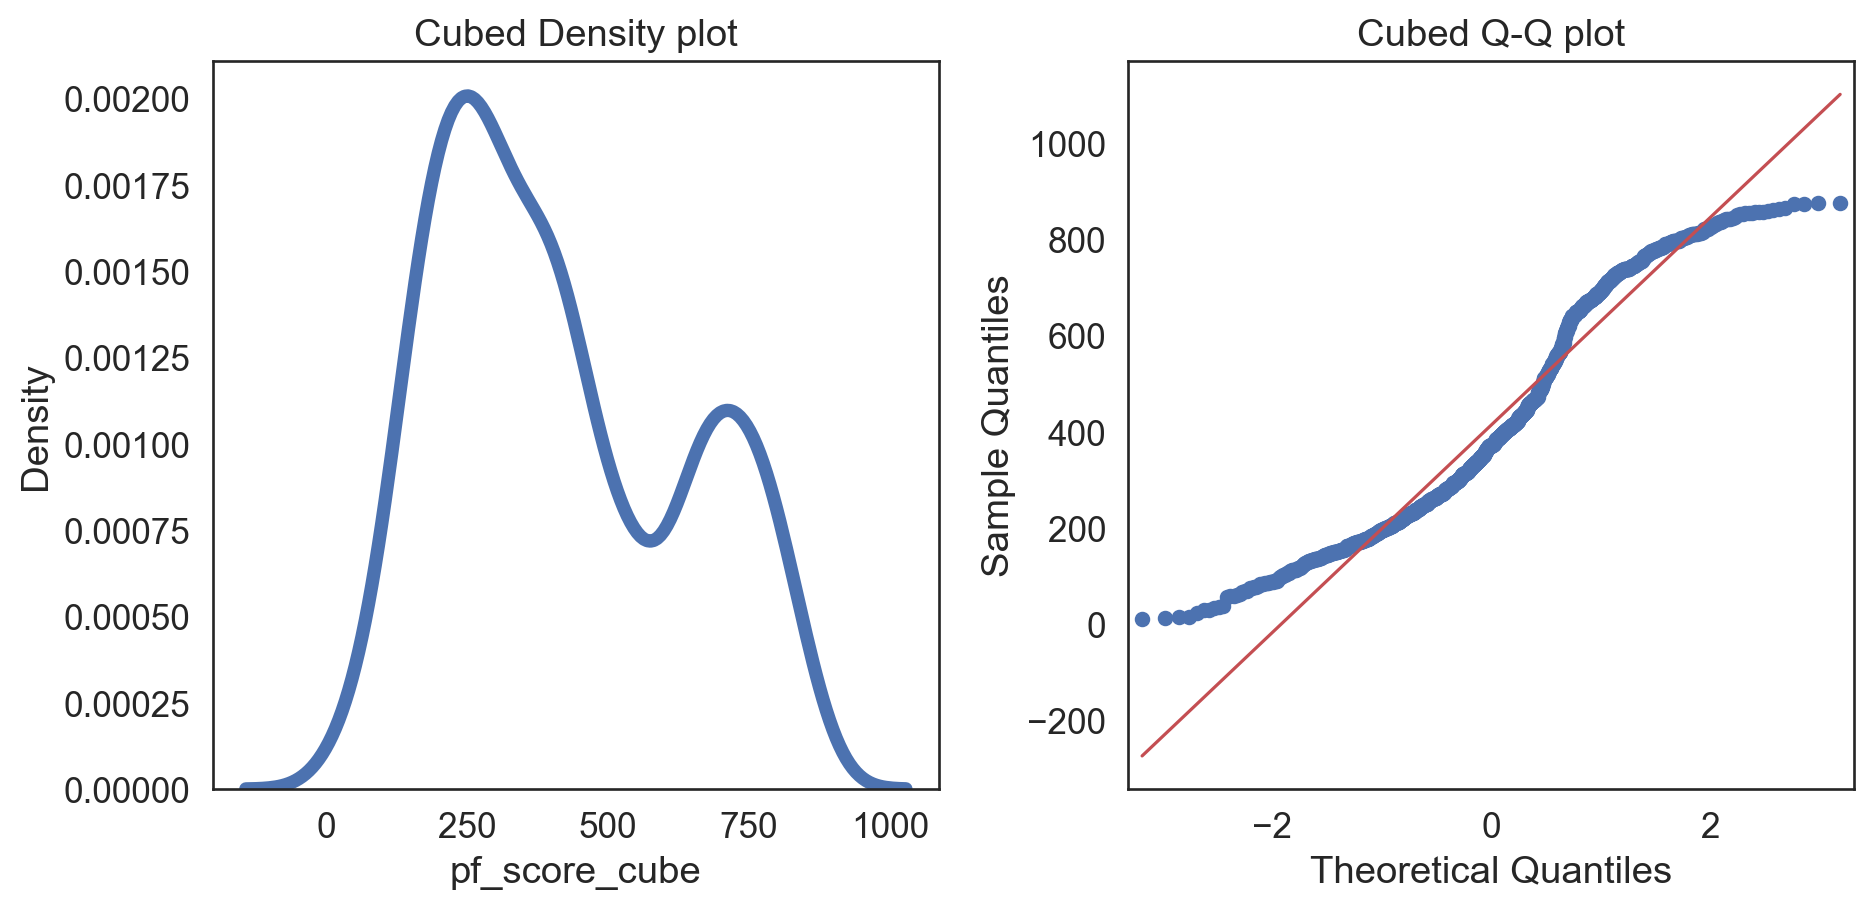
KDE: our data
Code
values = hfi_clean['pf_score_square']
kde = gaussian_kde(values, bw_method = 'scott')
x_eval = np.linspace(values.min(), values.max(), num = 500)
kde_values = kde(x_eval)

minima_indices = argrelextrema(kde_values, np.less)[0]
valleys = x_eval[minima_indices]

plt.figure(figsize = (7, 5))
plt.title('KDE and Valleys')
sns.lineplot(x = x_eval, y = kde_values, label = 'KDE')
plt.scatter(x = valleys, y = kde(valleys), color = 'r', zorder = 5, label = 'Valleys')
plt.legend()
plt.show()

print("Valley x-values:", valleys)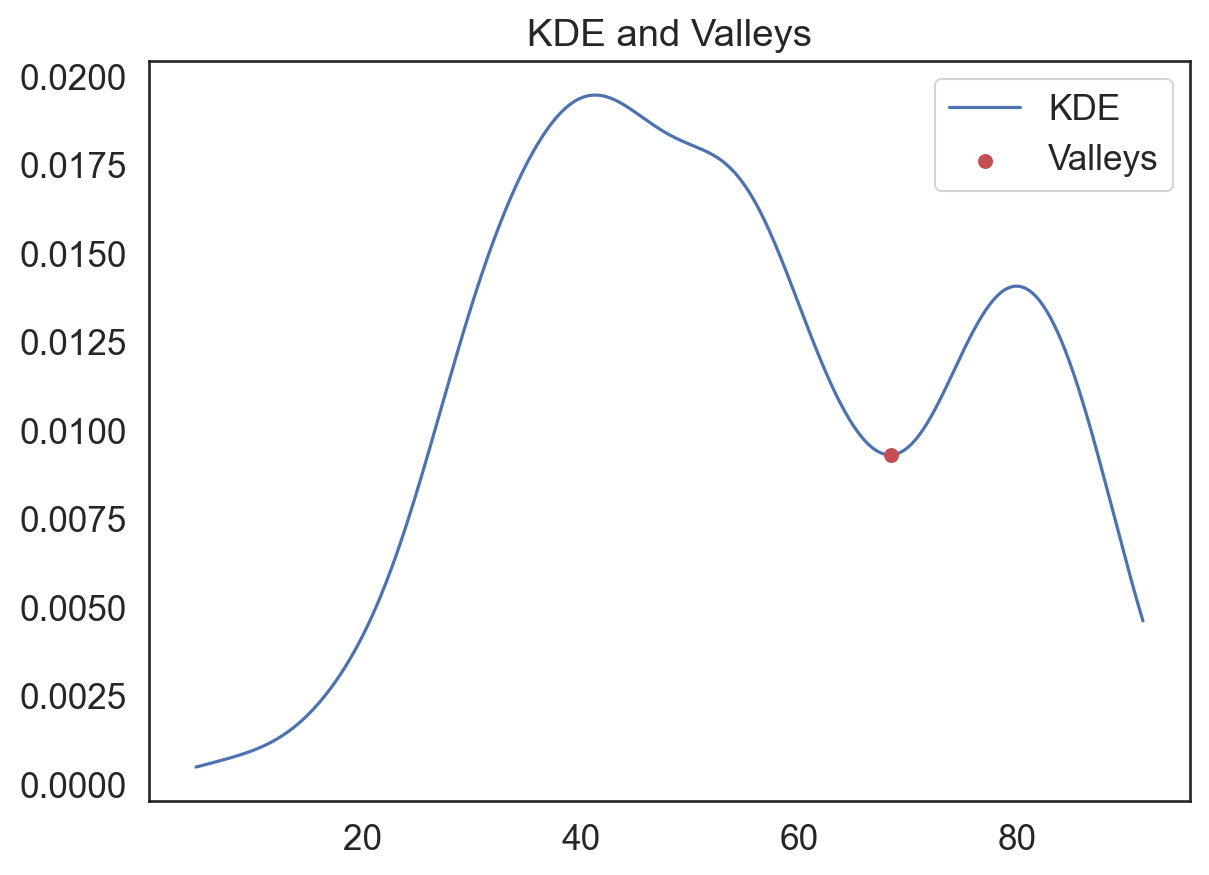
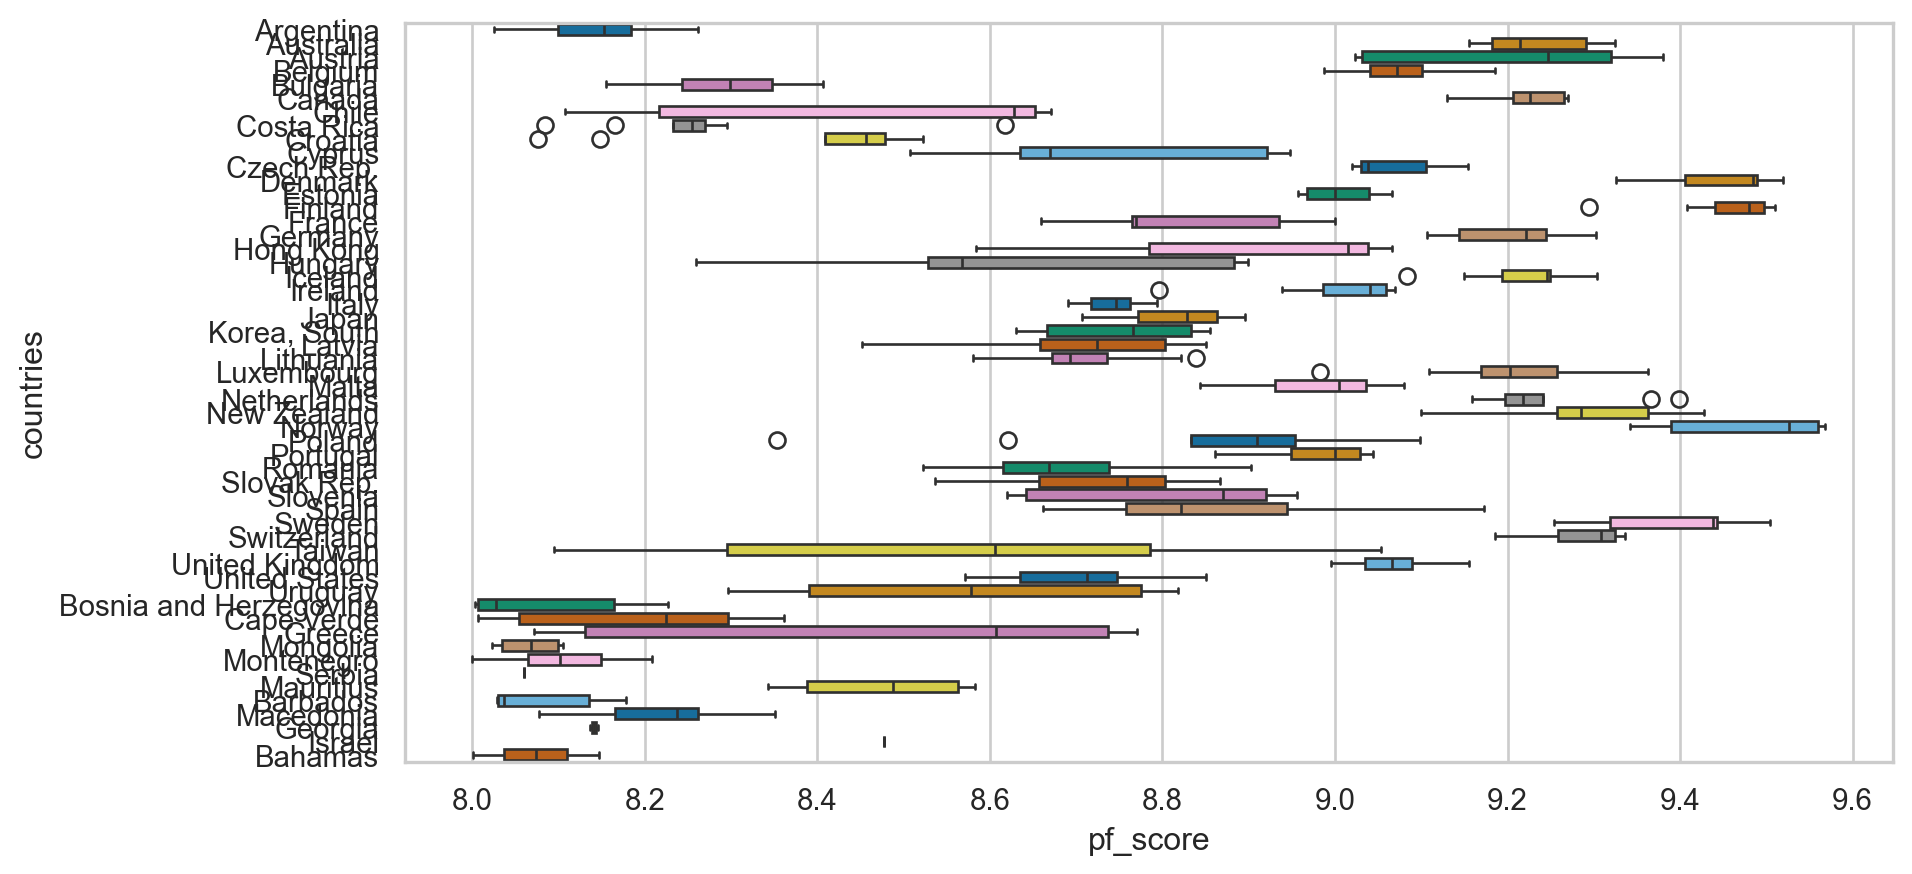
Valley x-values: [68.39968248]Plot the grouped data

Dimensional reduction: applied
numeric_cols = hfi.select_dtypes(include = [np.number]).columns

# Applying mean imputation only to numeric columns
hfi[numeric_cols] = hfi[numeric_cols].fillna(hfi[numeric_cols].mean())

features = ['pf_rol_procedural', 'pf_rol_civil', 'pf_rol_criminal', 'pf_rol', 'hf_score', 'hf_rank', 'hf_quartile']

x = hfi.loc[:, features].values
y = hfi.loc[:, 'region'].values
x = StandardScaler().fit_transform(x)
Code
pca = PCA(n_components = 2)
principalComponents = pca.fit_transform(x)
principalDf = pd.DataFrame(data = principalComponents, columns = ['principal component 1', 'principal component 2'])
pca_variance_explained = pca.explained_variance_ratio_
print("Variance explained:", pca_variance_explained, "\n", principalDf)
Variance explained: [0.76138995 0.15849799]
principal component 1 principal component 2
0 5.164625e-01 -9.665680e-01
1 -2.366765e+00 1.957381e+00
2 -2.147729e+00 1.664483e+00
3 -2.784437e-01 8.066415e-01
4 3.716205e-01 -4.294282e-01
... ... ...
1453 -4.181375e+00 -4.496988e-01
1454 -5.213024e-01 6.010449e-01
1455 1.374342e-16 -2.907121e-16
1456 -1.545577e+00 -5.422255e-01
1457 -3.669011e+00 4.294948e-01
[1458 rows x 2 columns]Code
# Combining the scatterplot of principal components with the scree plot using the correct column names
fig, axes = plt.subplots(nrows = 1, ncols = 2, figsize = (12, 5))

# Scatterplot of Principal Components
axes[0].scatter(principalDf['principal component 1'], principalDf['principal component 2'])
for i in range(len(pca.components_)):
    axes[0].arrow(0, 0, pca.components_[i, 0], pca.components_[i, 1], head_width = 0.1, head_length = 0.15, fc = 'r', ec = 'r', linewidth = 2)
    axes[0].text(pca.components_[i, 0] * 1.2, pca.components_[i, 1] * 1.2, f'Eigenvector {i+1}', color = 'r', fontsize = 12)
axes[0].set_xlabel('Principal Component 1')
axes[0].set_ylabel('Principal Component 2')
axes[0].set_title('Scatterplot of Principal Components with Eigenvectors')
axes[0].grid()

# Scree Plot for PCA
axes[1].bar(range(1, len(pca_variance_explained) + 1), pca_variance_explained, alpha = 0.6, color = 'g', label = 'Individual Explained Variance')
axes[1].set_ylabel('Explained variance ratio')
axes[1].set_xlabel('Principal components')
axes[1].set_title('Scree Plot for PCA')
axes[1].legend(loc='best')

plt.tight_layout()
plt.show()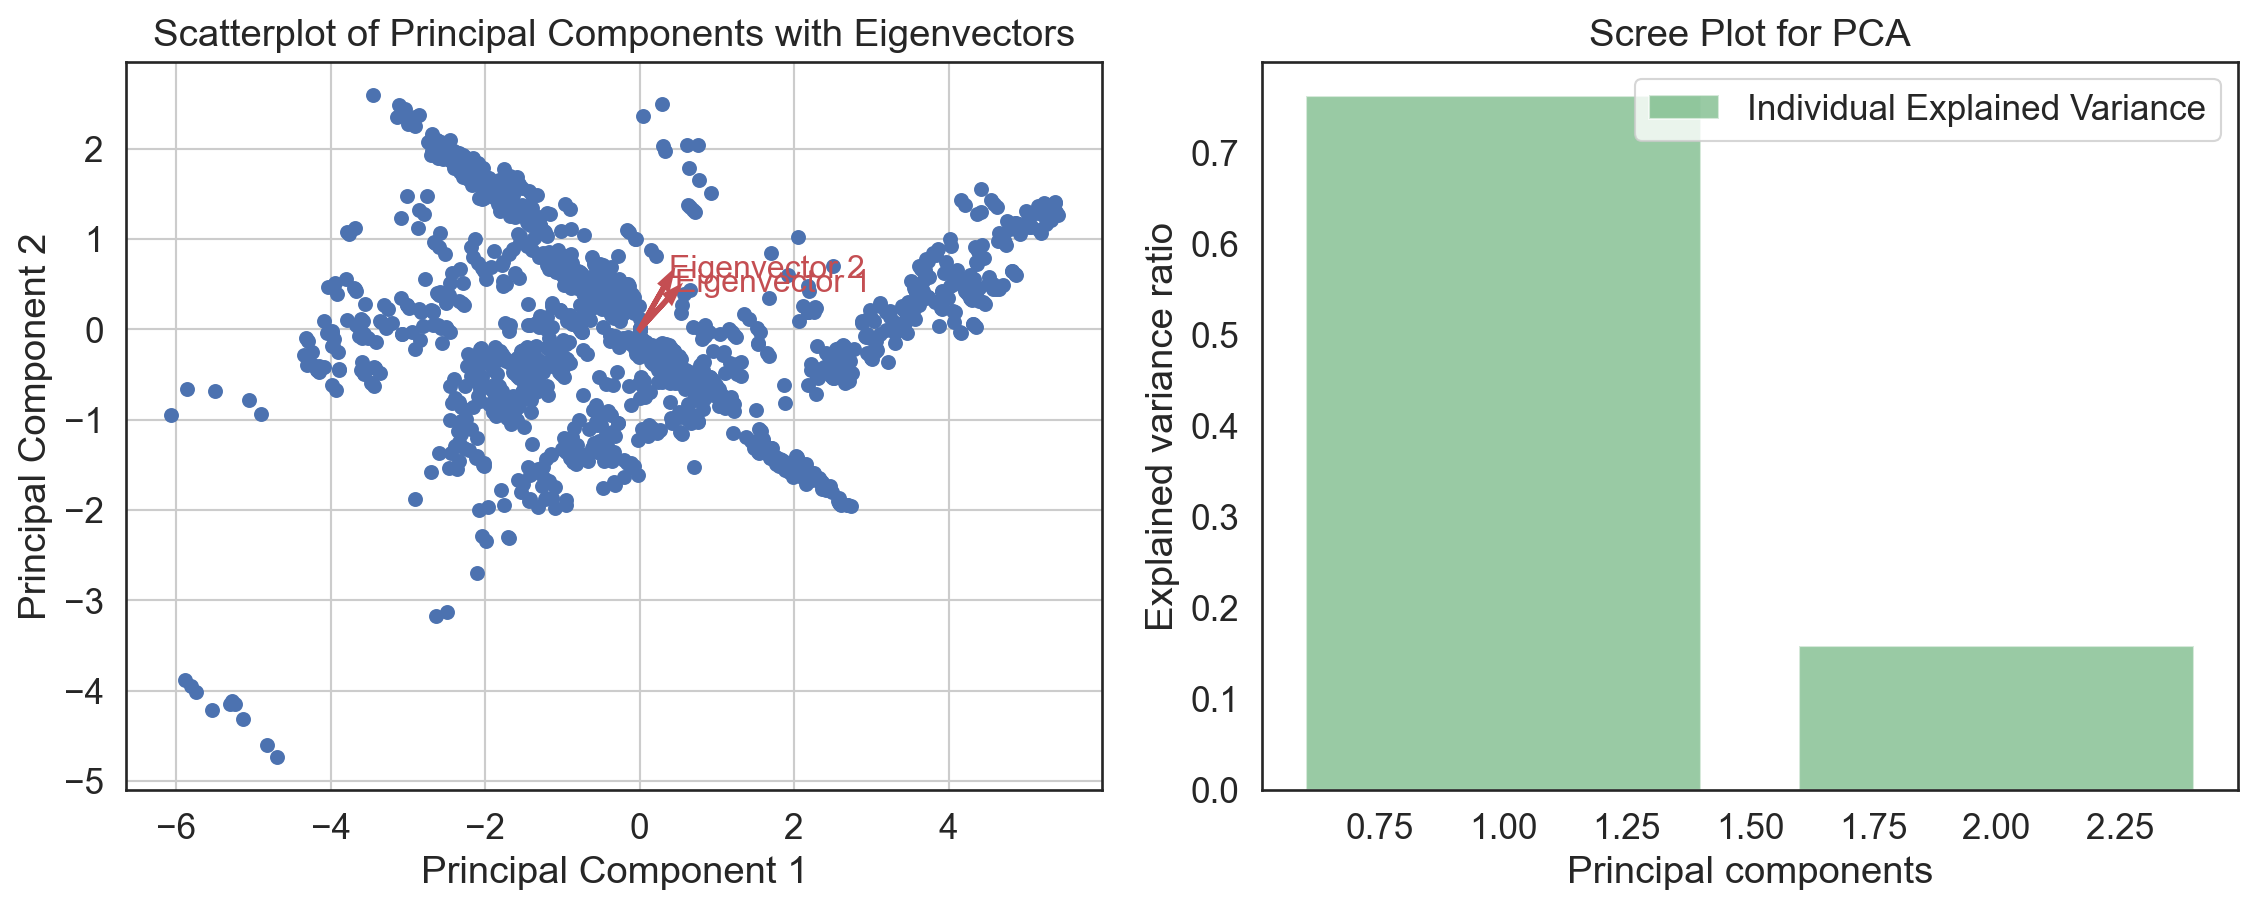
Code
| tsne-2d-one | tsne-2d-two | |
|---|---|---|
| 0 | 8.502221 | -30.431156 |
| 1 | -27.206896 | 34.969612 |
| 2 | -33.362232 | 34.534184 |
| 3 | -6.572413 | 15.950667 |
| 4 | 6.940447 | -18.942537 |
| ... | ... | ... |
| 1453 | -53.803455 | -8.352145 |
| 1454 | -12.337447 | 12.727315 |
| 1455 | 11.366165 | 6.299300 |
| 1456 | -19.138586 | -8.212263 |
| 1457 | -52.841946 | -2.509022 |
1458 rows × 2 columns
Code
tsne_df['region'] = y

plt.figure(figsize = (7, 5))
plt.scatter(tsne_df['tsne-2d-one'], tsne_df['tsne-2d-two'], c = pd.factorize(tsne_df['region'])[0], alpha=0.5)
plt.colorbar(ticks = range(len(np.unique(y))))
plt.xlabel('TSNE Dimension 1')
plt.ylabel('TSNE Dimension 2')
plt.title('t-SNE Results with Region Color Coding')
plt.show()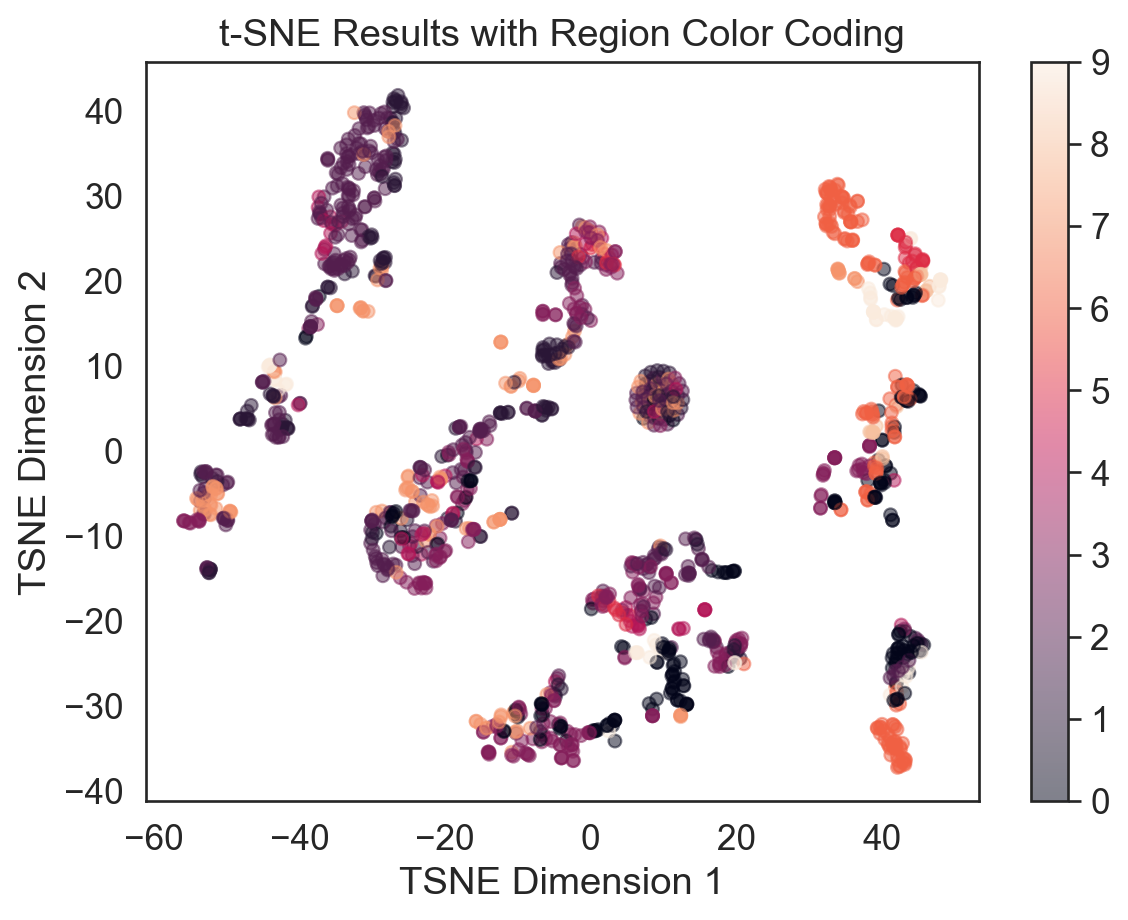
Normality test: Q-Q plot
Code
sns.set_style("white")
fig, (ax1, ax2) = plt.subplots(ncols = 2, nrows = 1)

sns.kdeplot(data = esi_hfi_red, x = "pf_score", linewidth = 5, ax = ax1)
ax1.set_title('Personal Freedom Score')

sm.qqplot(esi_hfi_red['pf_score'], line = 's', ax = ax2, dist = stats.norm, fit = True)
ax2.set_title('Personal Freedom Score Q-Q plot')

plt.tight_layout()
plt.show()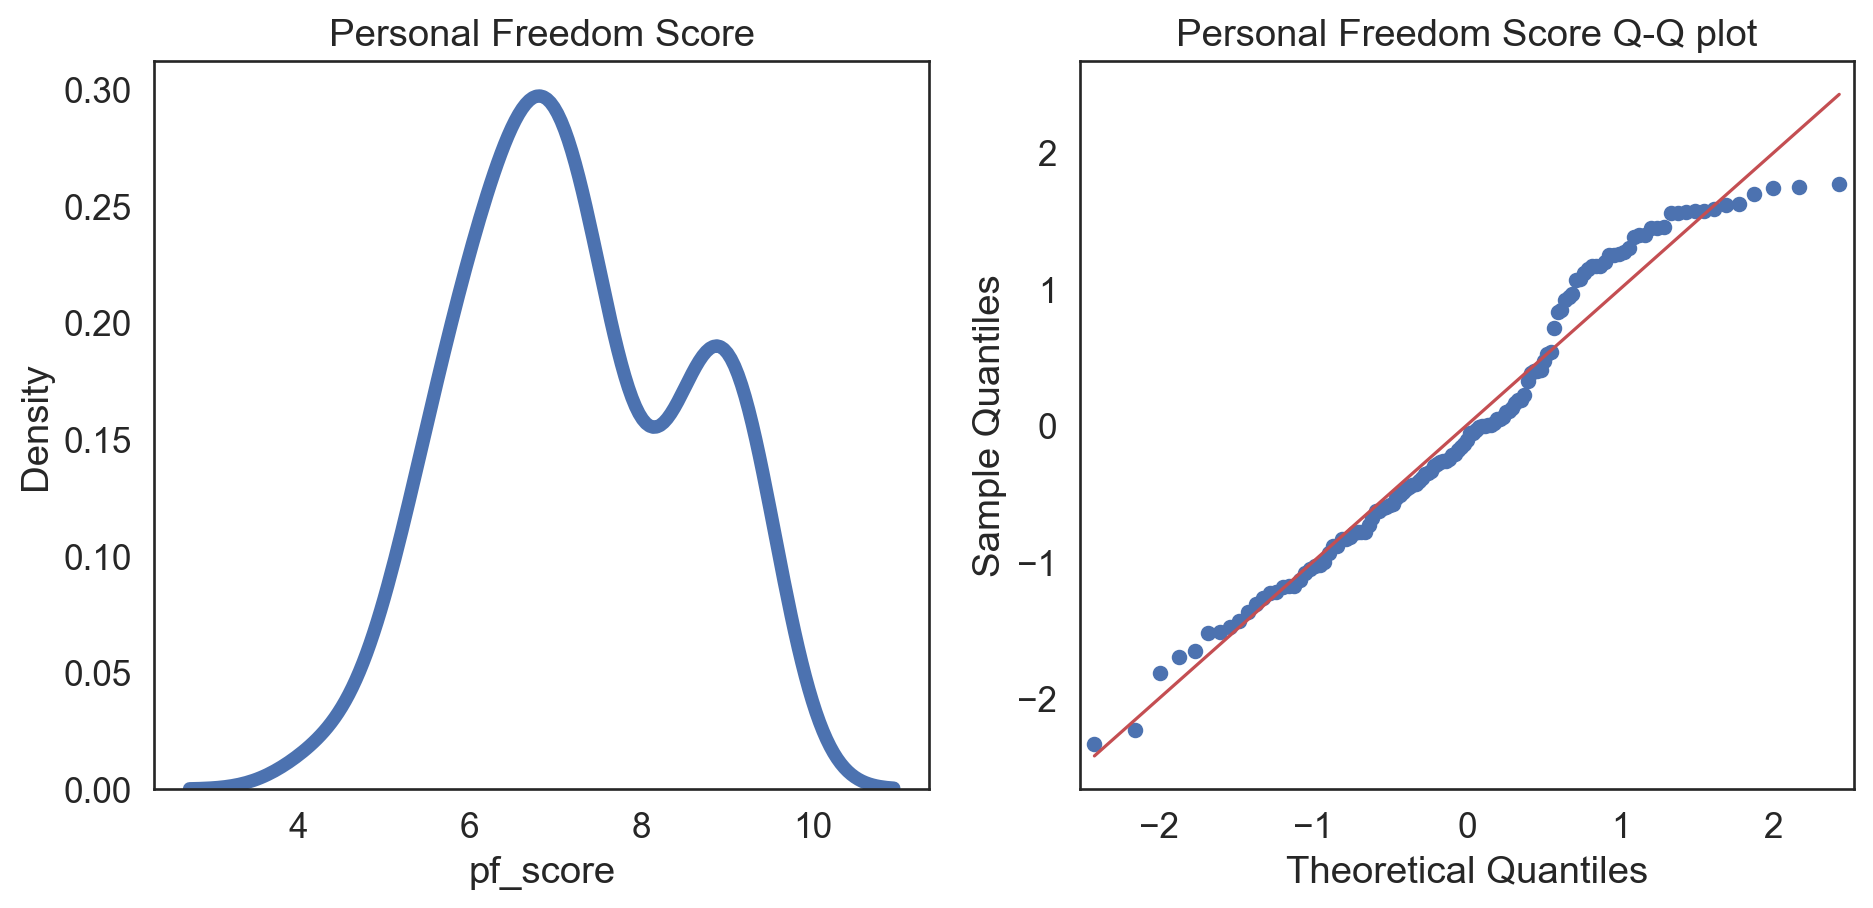
Code
fig, (ax1, ax2) = plt.subplots(ncols = 2, nrows = 1)

sns.kdeplot(data = esi_hfi_red, x = "esi", linewidth = 5, ax = ax1)
ax1.set_title('Environmental Stability Score')

sm.qqplot(esi_hfi_red['esi'], line = 's', ax = ax2, dist = stats.norm, fit = True)
ax2.set_title('Environmental Stability Score Q-Q plot')

plt.tight_layout()
plt.show()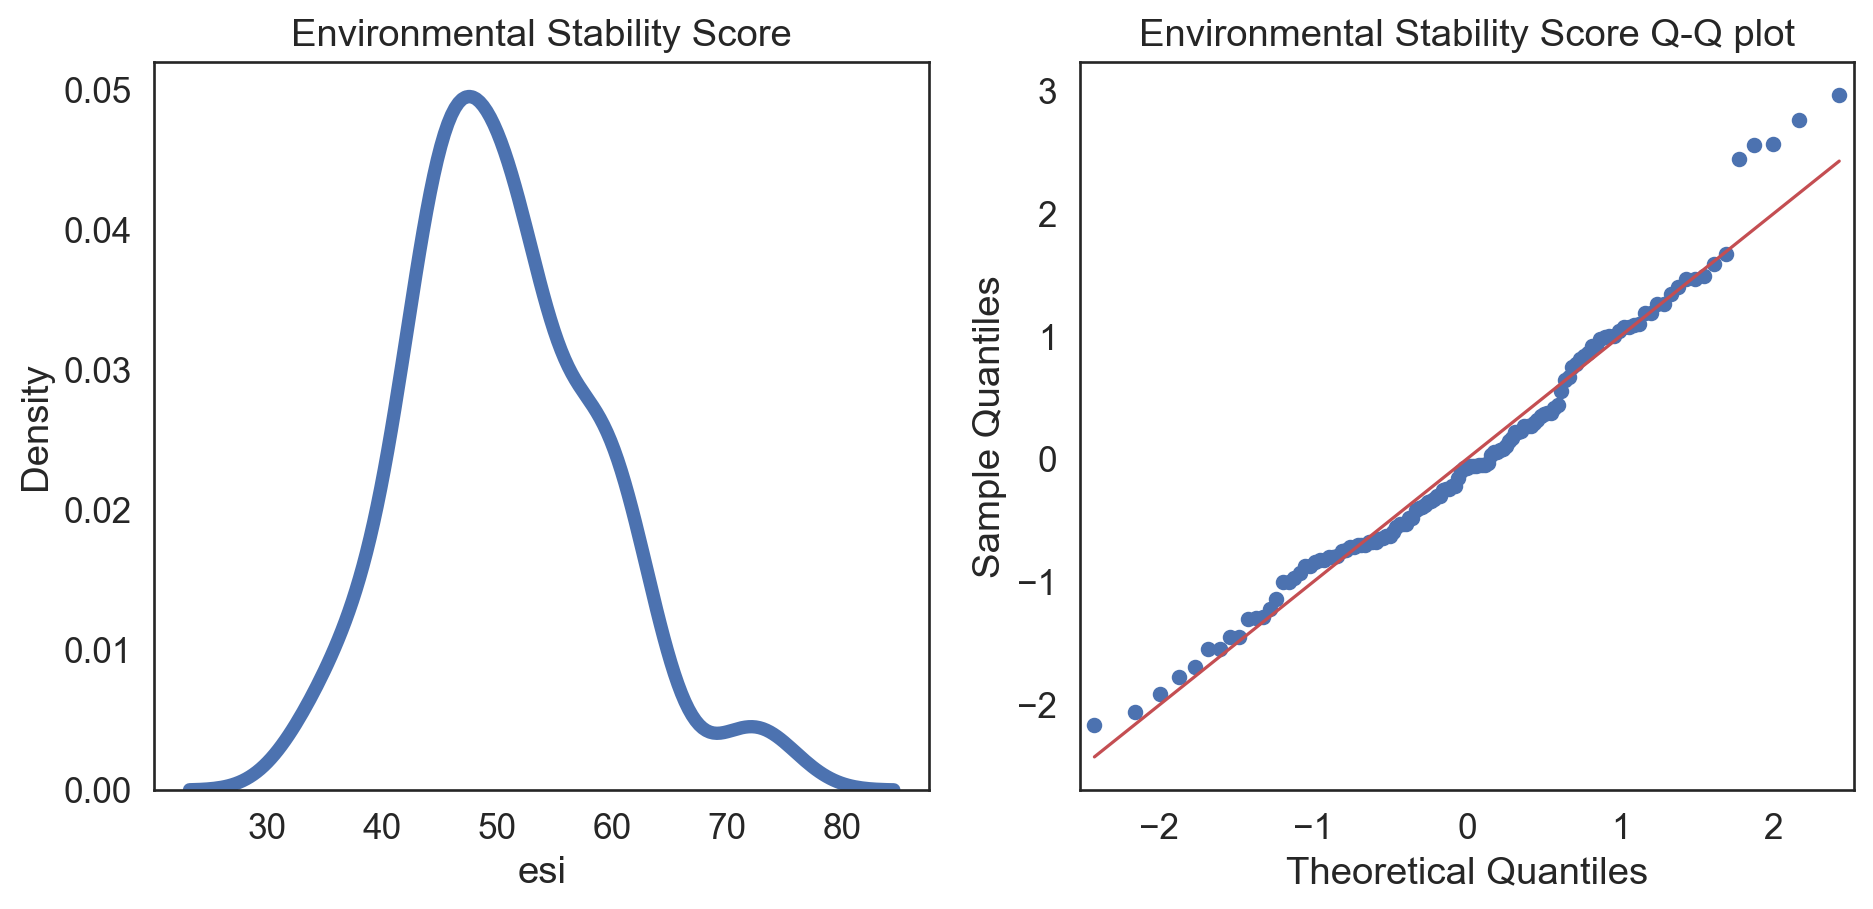
Correcting skew
Code
esi_hfi_red['pf_score_square'] = pow(esi_hfi_red.pf_score, 2)

col = esi_hfi_red['pf_score_square']

fig, (ax1, ax2) = plt.subplots(ncols = 2, nrows = 1)

sns.kdeplot(col, linewidth = 5, ax = ax1)
ax1.set_title('Squared Density plot')

sm.qqplot(col, line = 's', ax = ax2)
ax2.set_title('Squared Q-Q plot')
plt.tight_layout()
plt.show()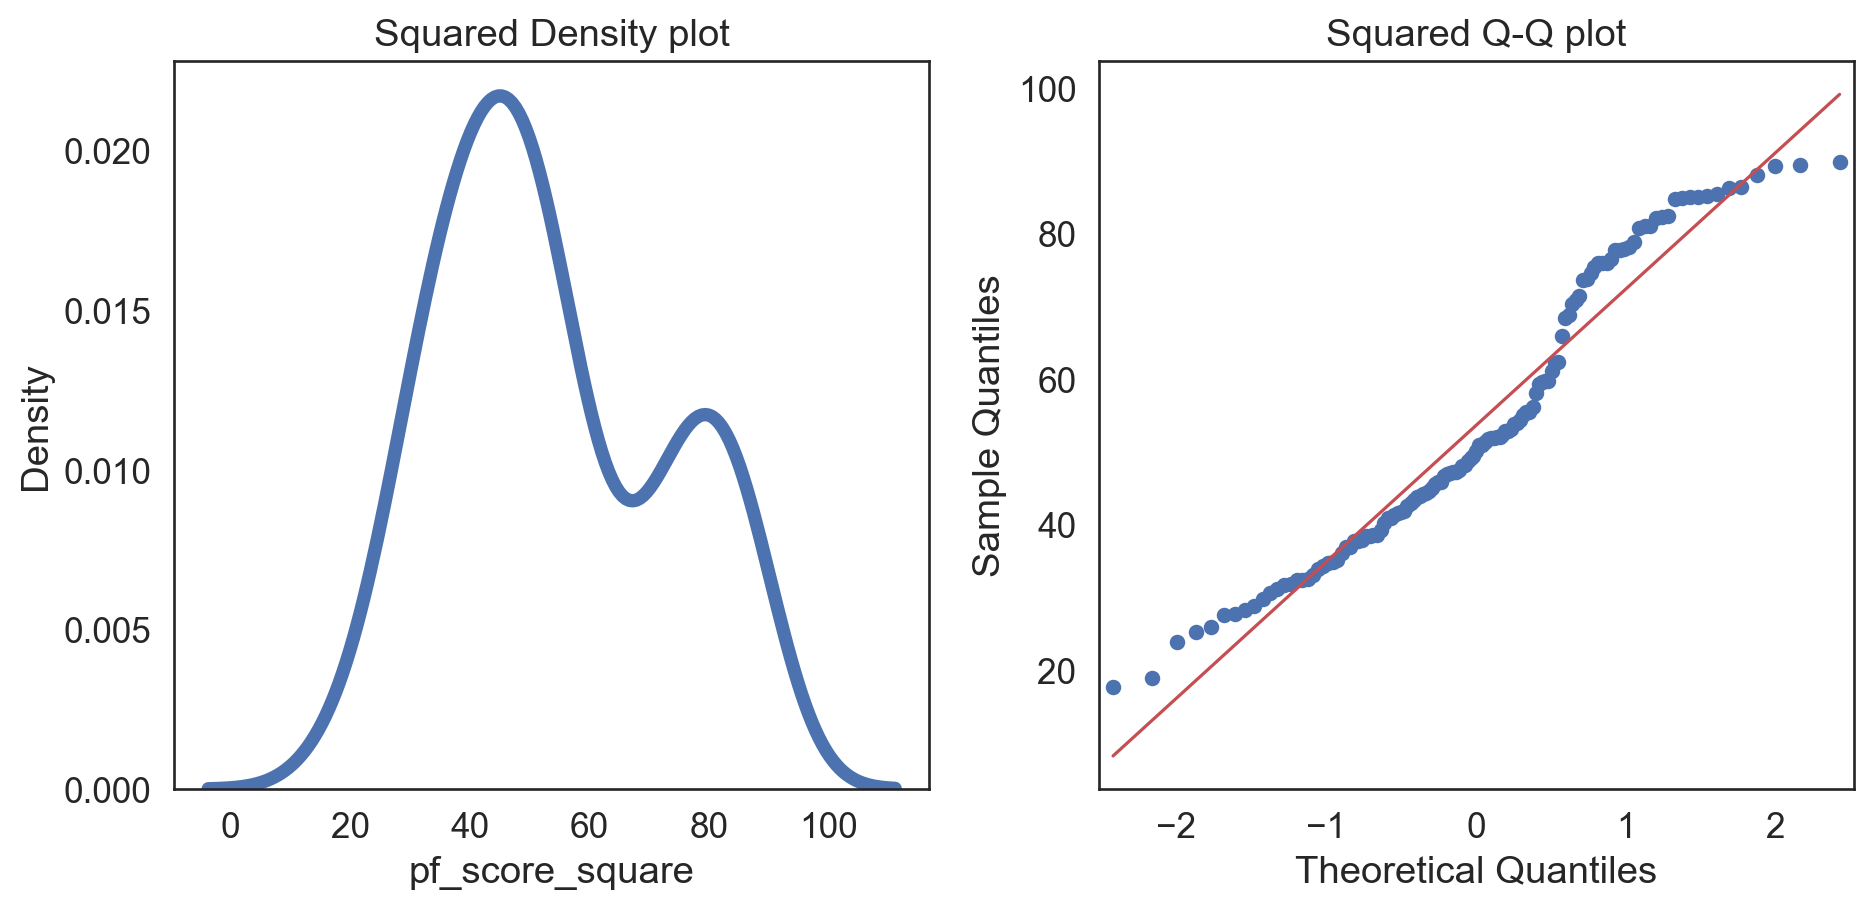
Code
esi_hfi_red['esi_log'] = np.log(esi_hfi_red.esi + 1)

col = esi_hfi_red['esi_log']

fig, (ax1, ax2) = plt.subplots(ncols = 2, nrows = 1)

sns.kdeplot(col, linewidth = 5, ax = ax1)
ax1.set_title('Log Density plot')

sm.qqplot(col, line = 's', ax = ax2)
ax2.set_title('Log Q-Q plot')
plt.tight_layout()
plt.show()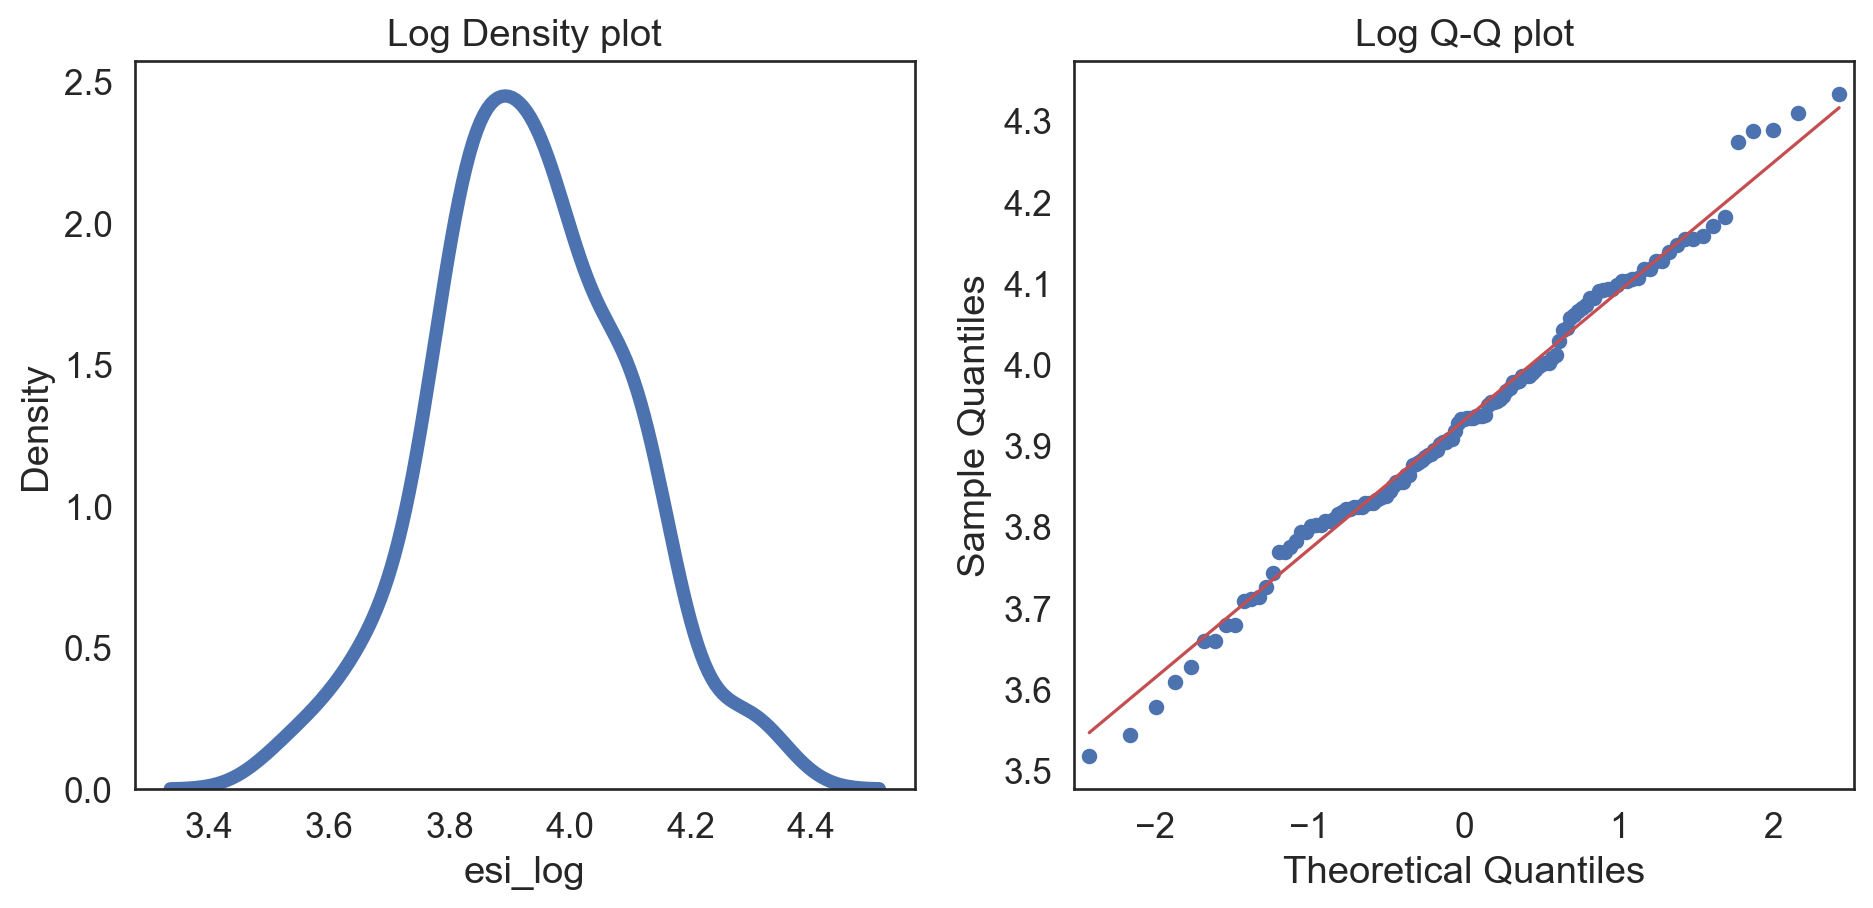
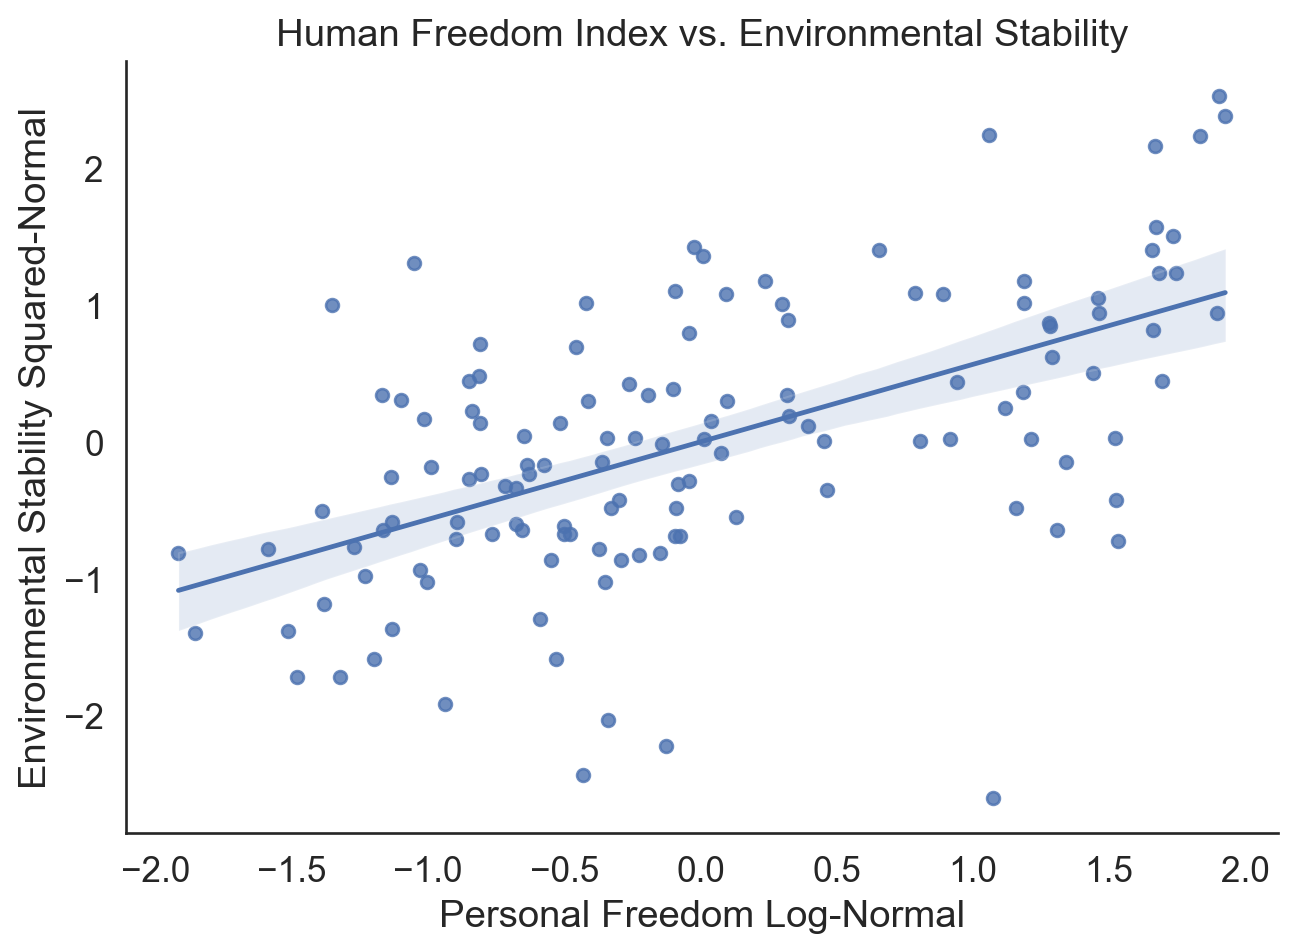
Correlations
| esi | pf_score | pf_score_square | esi_log | |
|---|---|---|---|---|
| esi | 1.000000 | 0.574756 | 0.583615 | 0.993689 |
| pf_score | 0.574756 | 1.000000 | 0.995631 | 0.560831 |
| pf_score_square | 0.583615 | 0.995631 | 1.000000 | 0.566744 |
| esi_log | 0.993689 | 0.560831 | 0.566744 | 1.000000 |
Code
plt.figure(figsize = (7, 5))
ax = sns.scatterplot(data = esi_hfi_red, x = "pf_score_square", y = "esi_log",
                hue = "region", palette = "colorblind")
ax.legend(title = "Region",
          bbox_to_anchor = (1.02, 1), loc = 'upper left', borderaxespad = 0)
ax.set(xlabel = "Personal Freedom Log-Normal ")
ax.set(ylabel = "Environmental Stability Squared-Normal")
ax.set(title = "Human Freedom Index vs. Environmental Stability")
plt.show()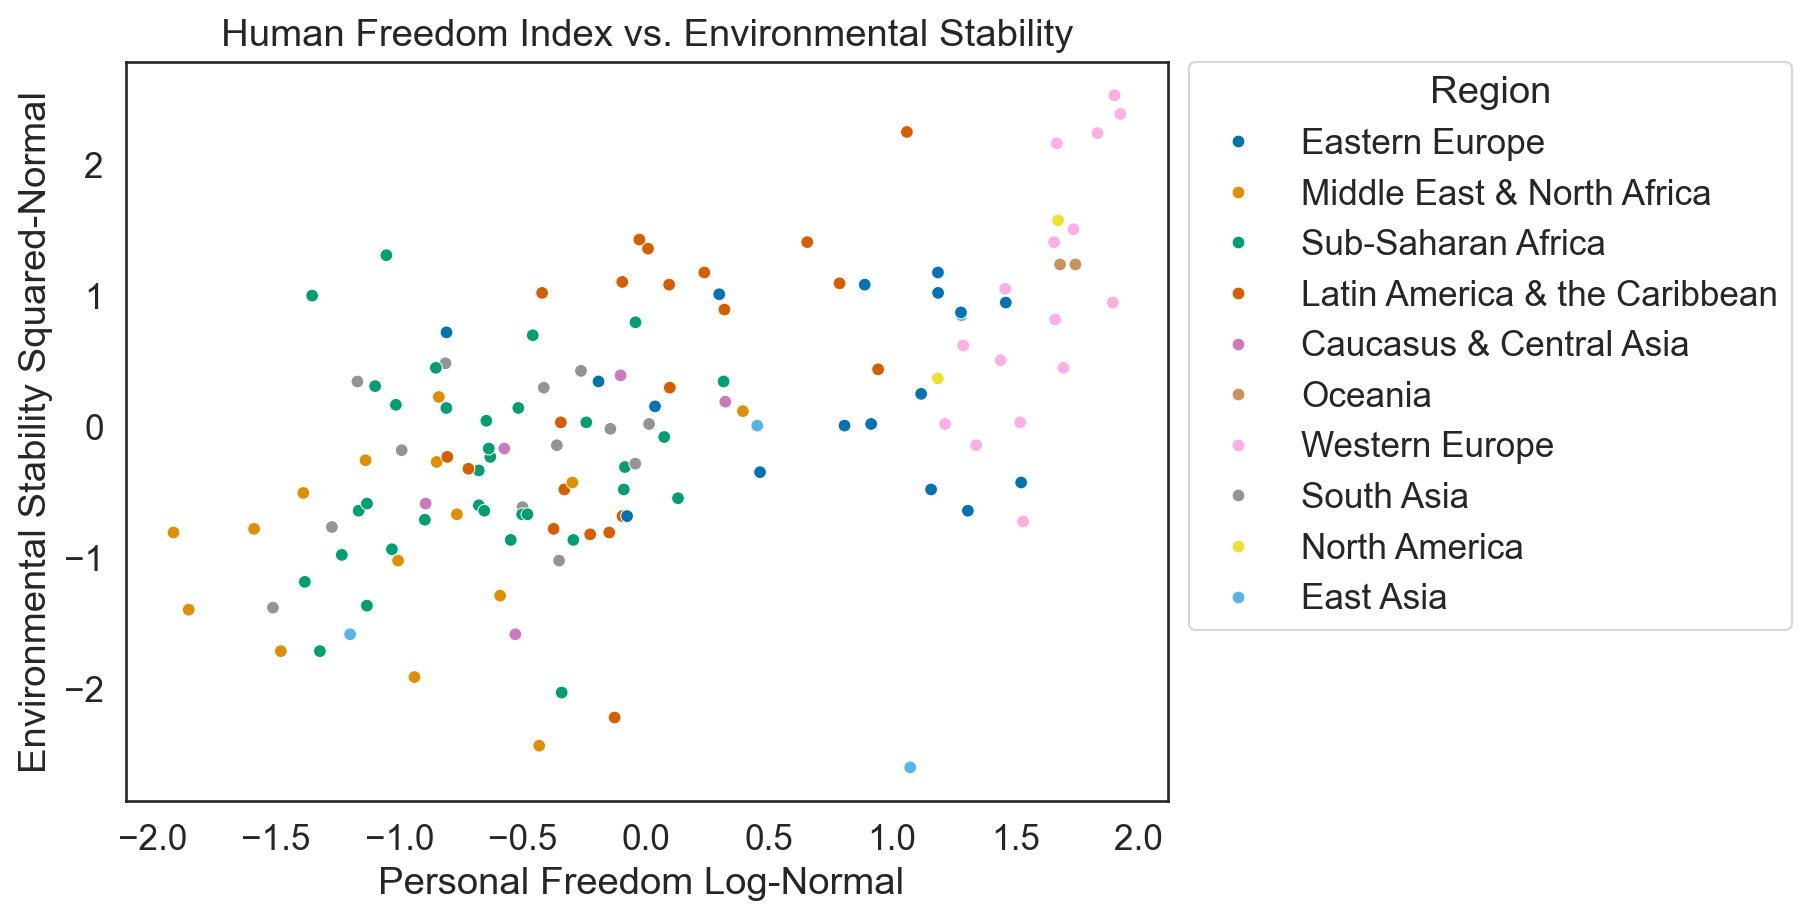
Correlations: p-value
Conclusions: data preprocessing
There are multiple steps:
Check the distribution for normality
Likely will need a transformation based on the severity and direction of skew
Normalize the data with different units
Correlations are a good start, but regressions are more definitive
It’s “as needed”, ergo we didn’t cover everything…
![]()